
SLIDE 1
Climate Risk Visualization for Adaptation Planning and Emergency - - PowerPoint PPT Presentation
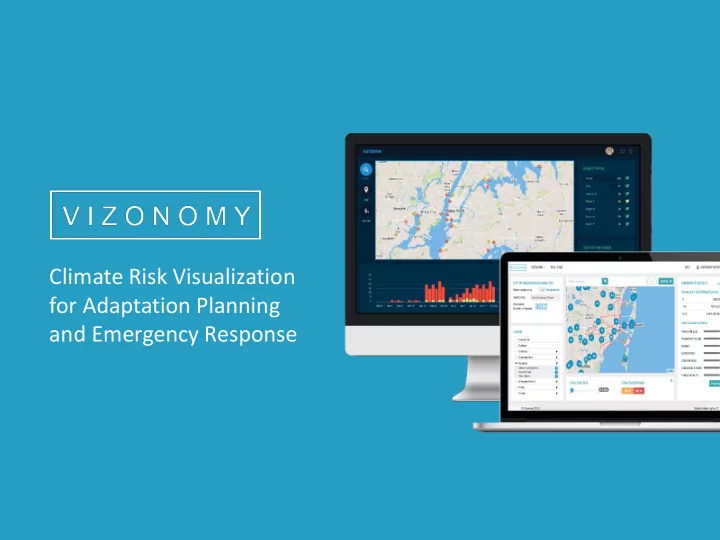
Climate Risk Visualization for Adaptation Planning and Emergency Response Assess Flood and Sea Level Rise Risk Leverage open data and open technologies to more easily visualize flood and sea level rise risk. Customize the analysis and share the
Founder and CEO: Ricardo Saavedra Year Founded: 2014
Location: 1133 15th St, Washington DC, 20005
Sea Level Rise Scenarios Openstreet Map Critical Infrastructure Satellite Imagery Adaptation Planning Social Media Terrain Flood Scenarios Demographics
Evaluate direct building losses using FEMA’s +500 loss assessment curves. Building footprints included. Obtain flood zone and depth for the 100 or 500YR flood and the 1 to 6ft Sea Level Rise scenarios.
Select +70 datasets from local, state, and federal sources to develop an
hospital, schools, roads, demographic info, and more. Determine which assets are exposed by hazard scenario within a neighborhood, city
With your customized analysis, share results within your agency through a private link or PDF report.
Develop a vulnerability analysis across 12 sectors,
maritime transport, health, emergency, etc. Determine how many assets by category and within each sector are exposed to FEMA’s 100 or 500yr floodplains or to each of NOAA’s 1ft to 6ft Sea Level Scenarios. Assess which assets are specifically exposed by
name, location, and depth.
Easily search hazard-related keywords from Twitter using semantic analysis. Filter results by time and location. See which areas are likely to be exposed to storm surge 12 to 24hrs in advance, using NOAA models. Coming Soon: Receive automated text and email updates on upcoming hazard events and assets exposed. Use for coordination and crowdsourcing equipment location.