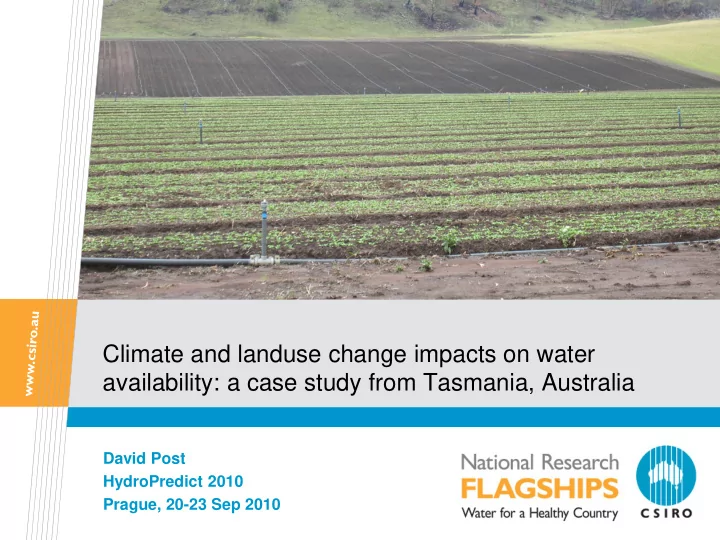

Climate and landuse change impacts on water availability: a case study from Tasmania, Australia David Post HydroPredict 2010 Prague, 20-23 Sep 2010
Background • Australia is the driest inhabited continent. In order to effectively manage its water resources, detailed, accurate (and therefore reliable) assessments of water availability are required. • The Australian Government has commissioned CSIRO to carry out water availability assessments for some of the major river systems across the country. • This presentation gives the methods used and some results for one such ‘sustainable yields’ project – for Tasmania, an island state in south eastern Australia where there are State and Commonwealth plans to increase the area of land under irrigated agriculture.
‘Sustainable yields’ project areas Northern Australia 1.25m km 2 $5.7m July 2009 Murray-Darling 1.01m km 2 $11m October 2008 Western Australia 0.08m km 2 Tasmania $5.2m 0.05m km 2 February 2010 $4.2m February 2010
Overview of project methods Historical climate Climate and Future climate scenario definition Future development - Rainfall-runoff and recharge modelling Rech arge Run off Groundwater River system Ecological modelling and modelling and assessment assessment assessment Reporting
Historical climate
Future climate 900 30 1981–2000 800 25 2046–2065 . Summer rainfall (mm) 700 Daily rainfall (mm) 600 20 500 15 400 10 300 200 5 100 0 0 0 10 20 30 40 50 12.0 12.5 13.0 13.5 14.0 14.5 15.0 15.5 Percent time daily rainfall is exceeded Annual global temperature (°C) • Calculate change in seasonal rainfall per degree global warming for 15 of the 23 GCMs in IPCC AR4 • Scale daily rainfall amounts differently depending on their size
Dynamic downscaling • Use spatial patterns of projected changes from dynamically-downscaled CCAM model to scale GCM results.
Rainfall-runoff modelling • Calibrate 5 models (SIMHYD, Sacramento, IHACRES, SMARG, AWBM) to 90 unregulated catchments • Evaluate model performance through cross-validation using parameters from the nearest neighbour • Choose optimal model and regionalise to ungauged areas.
Changes in rainfall and runoff by ~2030 Rainfall -6% -2% +1% Runoff +2% -3% -8%
Reporting metrics 150 Mean monthly runoff (mm) x Future range Historical climate Future median Historical Wet extreme future climate 100 Median future climate 50 Dry extreme future climate 0 5000 10000 15000 20000 25000 Average annual volume (GL) . 0 Non-extracted water Extracted water J F M A M J J A S O N D 0.5 100000 0 Future range EOS monthly flow (GL) 0.4 Percent change in EOS . monthly flow due to Future median EOS daily flow (ML) 10000 -5 0.4 . Historical . development 0.3 Without extractions 1000 -10 0.3 0.2 100 -15 0.2 Range 0.1 10 -20 Median 0.1 -25 1 0.0 0 20 40 60 80 100 J F M A M J J A S O N D J F M A M J J A S O N D Month Percent time volume is exceeded Month
Reporting metrics 1.0 5 Annual allocation (GL) 0.9 Annual volume (GL) Extracted volume per . . 4 0.8 0.7 unit allocated . 3 0.6 0.5 2 0.4 Future range 0.3 Future range 1 Future median 0.2 Future median Historical 0.1 Historical 0 0.0 0% 20% 40% 60% 80% 100% 0% 20% 40% 60% 80% 100% Percent of years exceeded Percent of years exceeded Annual water demand (GL) 6 1.0 5 Annual volume (GL) Extracted volume per . . 0.8 . unit allocated 4 0.6 3 0.4 2 D range D range 0.2 Dmid 1 Dmid 0.0 0 0% 20% 40% 60% 80% 100% 0% 20% 40% 60% 80% 100% Percent of years exceeded Percent of years exceeded
Ecological impacts Dry extreme future climate Historical climate • 2% of subcatchments • 1% of subcatchments and 15 key ecological and 13 key ecological sites are potentially sites are potentially impacted: impacted: • 10 river sections • 8 river sections • 4 riverine wetlands • 1 riverine wetlands • 1 Ramsar wetlands • 2 Ramsar wetlands • 0 estuaries • 2 estuaries
Conclusions • A method has been developed which allows estimates of current and future water availability to be made across very large regions. • The method includes assessments of changes in water availability due to changes in climate, as well as impacts due to catchment development such as forestry, irrigation and groundwater extractions. • The method produces a wide range of reporting metrics, including: Spatial patterns of changes in rainfall and runoff Current and future water availability and use at catchment scale Reliability of proposed future irrigation development schemes Impacts of climate change and catchment development on streamflows Ecological impacts of projected changes in streamflows.
Recommend
More recommend