SLIDE 1
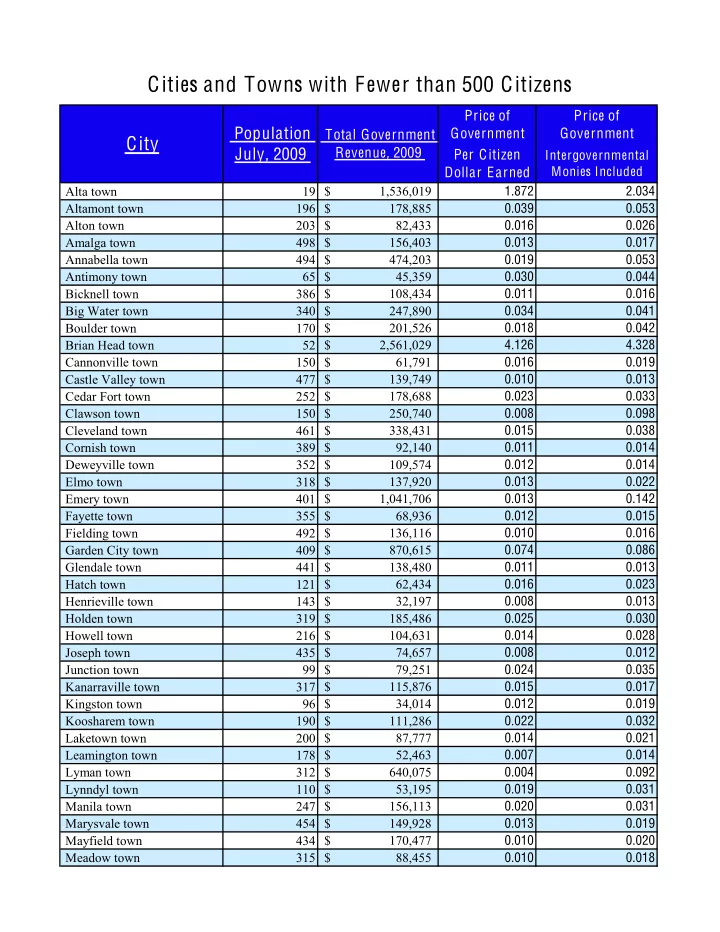
Price of Government Price of Government Per Citizen Dollar Earned
Intergovernmental Monies Included .Alta town 19 1,536,019 $ 1.872 2.034 .Altamont town 196 178,885 $ 0.039 0.053 .Alton town 203 82,433 $ 0.016 0.026 .Amalga town 498 156,403 $ 0.013 0.017 .Annabella town 494 474,203 $ 0.019 0.053 .Antimony town 65 45,359 $ 0.030 0.044 .Bicknell town 386 108,434 $ 0.011 0.016 .Big Water town 340 247,890 $ 0.034 0.041 .Boulder town 170 201,526 $ 0.018 0.042 .Brian Head town 52 2,561,029 $ 4.126 4.328 .Cannonville town 150 61,791 $ 0.016 0.019 .Castle Valley town 477 139,749 $ 0.010 0.013 .Cedar Fort town 252 178,688 $ 0.023 0.033 .Clawson town 150 250,740 $ 0.008 0.098 .Cleveland town 461 338,431 $ 0.015 0.038 .Cornish town 389 92,140 $ 0.011 0.014 .Deweyville town 352 109,574 $ 0.012 0.014 .Elmo town 318 137,920 $ 0.013 0.022 .Emery town 401 1,041,706 $ 0.013 0.142 .Fayette town 355 68,936 $ 0.012 0.015 .Fielding town 492 136,116 $ 0.010 0.016 .Garden City town 409 870,615 $ 0.074 0.086 .Glendale town 441 138,480 $ 0.011 0.013 .Hatch town 121 62,434 $ 0.016 0.023 .Henrieville town 143 32,197 $ 0.008 0.013 .Holden town 319 185,486 $ 0.025 0.030 .Howell town 216 104,631 $ 0.014 0.028 .Joseph town 435 74,657 $ 0.008 0.012 .Junction town 99 79,251 $ 0.024 0.035 .Kanarraville town 317 115,876 $ 0.015 0.017 .Kingston town 96 34,014 $ 0.012 0.019 .Koosharem town 190 111,286 $ 0.022 0.032 .Laketown town 200 87,777 $ 0.014 0.021 .Leamington town 178 52,463 $ 0.007 0.014 .Lyman town 312 640,075 $ 0.004 0.092 .Lynndyl town 110 53,195 $ 0.019 0.031 .Manila town 247 156,113 $ 0.020 0.031 .Marysvale town 454 149,928 $ 0.013 0.019 .Mayfield town 434 170,477 $ 0.010 0.020 .Meadow town 315 88,455 $ 0.010 0.018
City
Population July, 2009
Total Government Revenue, 2009
Cities and Towns with Fewer than 500 Citizens
SLIDE 2
Price of Government Price of Government Per Citizen Dollar Earned
Intergovernmental Monies Included .New Harmony town 184 96,848 $ 0.023 0.026 .Paragonah town 371 245,639 $ 0.017 0.036 .Plymouth town 290 134,238 $ 0.022 0.027 .Portage town 239 87,711 $ 0.011 0.020 .Rockville town 195 145,011 $ 0.018 0.022 .Rush Valley town 380 139,779 $ 0.010 0.018 .Scipio town 196 212,430 $ 0.024 0.046 .Scofield town 28 666,267 $ 0.054 1.050 .Sigurd town 376 170,158 $ 0.014 0.027 .Snowville town 118 219,638 $ 0.077 0.096 .Sterling town 349 57,782 $ 0.007 0.009 .Tabiona town 223 77,602 $ 0.006 0.017 .Torrey town 95 112,564 $ 0.019 0.044 .Vernon town 228 82,820 $ 0.012 0.025 .Vineyard town 133 713,889 $ 0.296 0.303 .Virgin town 457 260,998 $ 0.023 0.035 .Wales town 370 107,349 $ 0.007 0.020 .Wallsburg town 360 75,153 $ 0.008 0.010 .Woodruff town 158 64,394 $ 0.025 0.029 Mean 271 254,672 $ 0.032 0.049 Median 252 136,116 $ 0.017 0.028
City
Population July, 2009
Total Government Revenue, 2009
SLIDE 3
Price of Government Price of Government Per Citizen Dollar Earned
Intergovernmental Monies Included .Ballard town 549 891,808 $ 0.052 0.084 .Bear River City city 821 230,617 $ 0.009 0.013 .Charleston town 688 178,902 $ 0.007 0.008 .Circleville town 571 207,583 $ 0.018 0.024 .Clarkston town 789 326,340 $ 0.015 0.023 .Corinne city 847 417,834 $ 0.020 0.029 .Daniel town 890 178,525 $ 0.007 0.009 .Elsinore town 967 273,922 $ 0.016 0.021 .Escalante city 839 542,675 $ 0.015 0.021 .Eureka city 719 428,890 $ 0.013 0.029 .Fountain Green city 864 346,172 $ 0.016 0.021 .Glenwood town 547 129,898 $ 0.009 0.012 .Green River city 854 1,131,268 $ 0.049 0.067 .Henefer town 769 199,756 $ 0.008 0.011 .Hinckley town 897 422,324 $ 0.008 0.021 .Huntsville town 687 337,252 $ 0.012 0.016 .Kanosh town 650 232,967 $ 0.016 0.026 .Leeds town 782 298,081 $ 0.012 0.016 .Loa town 581 187,166 $ 0.013 0.020 .Mantua town 700 403,529 $ 0.019 0.021 .Minersville town 669 347,015 $ 0.017 0.024 .Myton city 633 1,272,013 $ 0.049 0.122 .Newton town 692 296,305 $ 0.016 0.021 .Oak City town 668 188,568 $ 0.010 0.013 .Orderville town 789 665,275 $ 0.033 0.068 .Paradise town 791 308,695 $ 0.015 0.020 .Randolph city 670 150,486 $ 0.009 0.012 .Redmond town 793 213,883 $ 0.013 0.017 .Rocky Ridge town 681 118,091 $ 0.017 0.020 .Springdale town 574 1,492,560 $ 0.106 0.119 .Stockton town 535 245,807 $ 0.017 0.021 .Sunnyside city 506 584,524 $ 0.056 0.084 .Trenton town 512 185,190 $ 0.019 0.026 .Tropic town 654 320,468 $ 0.010 0.017 .Wendover city 936 870,619 $ 0.054 0.065 Mean 718 417,857 $ 0.022 0.033 Median 692 308,695 $ 0.016 0.021
Cities and Towns with 500-999 Citizens
City
Population July, 2009
Total Government Revenue, 2009
SLIDE 4
Price of Government Price of Government Per Citizen Dollar Earned
Intergovernmental Monies Included .Aurora city 1,071 282,931 $ 0.009 0.013 .Beaver city 2,577 1,678,153 $ 0.031 0.047 .Blanding city 2,955 2,457,420 $ 0.031 0.060 .Castle Dale city 1,612 616,506 $ 0.018 0.021 .Centerfield town 1,499 377,505 $ 0.014 0.017 .Coalville city 1,688 1,348,189 $ 0.034 0.041 .Delta city 3,157 2,297,882 $ 0.032 0.041 .Duchesne city 1,856 798,310 $ 0.022 0.024 .East Carbon city 1,376 1,829,377 $ 0.039 0.074 .Elk Ridge city 2,808 1,005,015 $ 0.014 0.016 .Elwood town 1,030 254,480 $ 0.009 0.012 .Enoch city 4,877 1,411,588 $ 0.015 0.019 .Enterprise city 1,105 860,117 $ 0.024 0.031 .Ephraim city 4,611 2,862,829 $ 0.041 0.047 .Fairview city 1,224 550,782 $ 0.019 0.023 .Ferron city 1,507 2,201,299 $ 0.016 0.072 .Fillmore city 2,310 2,259,351 $ 0.048 0.056 .Garland city 2,076 931,422 $ 0.022 0.025 .Genola town 1,824 503,418 $ 0.013 0.018 .Goshen town 1,117 624,583 $ 0.014 0.037 .Gunnison city 1,600 1,357,648 $ 0.063 0.076 .Helper city 2,135 1,139,667 $ 0.022 0.025 .Hildale city 1,474 831,127 $ 0.092 0.103 .Honeyville city 1,251 334,644 $ 0.011 0.015 .Huntington city 2,229 1,226,837 $ 0.016 0.030 .Hyde Park city 3,736 1,560,584 $ 0.016 0.018 .Kamas city 1,845 1,503,795 $ 0.037 0.042 .Kanab city 3,510 2,607,998 $ 0.028 0.037 .La Verkin city 4,301 1,363,832 $ 0.017 0.019 .Levan town 1,073 349,607 $ 0.014 0.017 .Lewiston city 1,781 941,072 $ 0.025 0.031 .Manti city 3,227 1,904,787 $ 0.036 0.043 .Marriott-Slaterville city 1,816 1,458,523 $ 0.022 0.031 .Mendon city 1,308 413,706 $ 0.014 0.017 .Midway city 3,384 2,816,369 $ 0.023 0.025 .Milford city 1,706 1,278,506 $ 0.036 0.045 .Millville city 1,547 580,861 $ 0.017 0.020 .Mona city 1,159 366,832 $ 0.014 0.017 .Monroe city 2,539 606,295 $ 0.008 0.013 .Monticello city 2,212 3,337,621 $ 0.028 0.077
Cities and Towns with 1,000-4,999 Citizens
City
Population July, 2009
Total Government Revenue, 2009
SLIDE 5
Price of Government Price of Government Per Citizen Dollar Earned
Intergovernmental Monies Included .Morgan city 3,203 1,496,115 $ 0.020 0.022 .Moroni city 1,406 626,371 $ 0.025 0.031 .Mount Pleasant city 2,751 1,625,851 $ 0.033 0.038 .Naples city 1,490 3,980,837 $ 0.099 0.116 .Nibley city 4,044 1,964,074 $ 0.026 0.029 .Oakley city 1,183 658,729 $ 0.018 0.020 .Orangeville city 1,292 451,985 $ 0.019 0.023 .Panguitch city 1,697 1,142,039 $ 0.030 0.039 .Parowan city 2,518 1,945,112 $ 0.032 0.039 .Perry city 3,583 1,813,154 $ 0.020 0.022 .Plain City city 4,920 1,509,557 $ 0.012 0.013 .Richmond city 2,449 977,389 $ 0.019 0.022 .River Heights city 1,920 658,107 $ 0.012 0.016 .Roosevelt city 4,848 6,432,009 $ 0.055 0.064 .Salina city 2,509 1,520,817 $ 0.029 0.035 .Spring City city 1,222 362,989 $ 0.014 0.020 .Sunset city 4,945 2,352,442 $ 0.023 0.027 .Toquerville town 1,334 540,089 $ 0.017 0.020 .Uintah town 1,437 460,401 $ 0.011 0.012 .Wellington city 1,492 795,548 $ 0.026 0.029 .Wellsville city 3,219 1,612,404 $ 0.018 0.023 .Willard city 2,053 692,672 $ 0.013 0.015 .Woodland Hills city 1,677 781,552 $ 0.015 0.018 Mean 2,275 1,357,646 $ 0.025 0.033 Median 1,845 1,142,039 $ 0.020 0.025
City
Population July, 2009
Total Government Revenue, 2009
SLIDE 6
Price of Government Price of Government Per Citizen Dollar Earned
Intergovernmental Monies Included .Alpine city 9,651 3,357,147 $ 0.009 0.010 .Bluffdale city 7,425 3,178,731 $ 0.016 0.017 .Brigham City city 18,031 133,433,185 $ 0.354 0.363 .Cedar Hills Town 8,974 3,322,861 $ 0.015 0.017 .Centerville city 15,449 99,956,246 $ 0.222 0.227 .Clinton city 18,964 7,670,078 $ 0.018 0.019 .Eagle Mountain city 18,960 8,805,243 $ 0.025 0.029 .Farmington city 15,919 8,892,235 $ 0.016 0.019 .Farr West city 5,074 1,663,333 $ 0.011 0.013 .Fruit Heights city 5,102 1,646,058 $ 0.009 0.010 .Grantsville city 8,359 4,161,689 $ 0.020 0.024 .Harrisville city 5,570 2,584,669 $ 0.019 0.021 .Heber city 9,614 5,091,301 $ 0.024 0.027 .Herriman city 16,225 17,393,309 $ 0.027 0.045 .Highland city 15,230 6,925,774 $ 0.016 0.017 .Hooper city 5,113 1,635,642 $ 0.010 0.013 .Hurricane city 12,486 10,603,952 $ 0.037 0.042 .Hyrum city 7,518 3,028,379 $ 0.020 0.024 .Ivins city 7,414 4,194,074 $ 0.020 0.023 .Lindon city 10,088 7,735,897 $ 0.031 0.033 .Mapleton city 7,678 3,644,848 $ 0.019 0.021 .Moab city 5,070 7,023,707 $ 0.069 0.074 .Nephi city 5,140 3,598,160 $ 0.020 0.040 .North Logan city 8,009 5,304,793 $ 0.029 0.032 .North Ogden city 17,146 6,783,918 $ 0.014 0.015 .North Salt Lake city 12,489 9,752,766 $ 0.021 0.023 .Park City city 8,015 33,164,919 $ 0.087 0.093 .Payson city 17,167 7,595,450 $ 0.024 0.027 .Pleasant View city 6,720 3,137,959 $ 0.014 0.016 .Price city 7,412 6,804,467 $ 0.046 0.054 .Providence city 6,292 2,819,899 $ 0.016 0.017 .Richfield city 6,492 7,369,362 $ 0.041 0.057 .Riverdale city 8,039 8,281,767 $ 0.045 0.046 .Salem city 6,104 3,537,703 $ 0.025 0.028 .Santa Clara city 6,473 2,959,682 $ 0.016 0.018 .Santaquin city 7,656 3,222,228 $ 0.021 0.024 .Saratoga Springs city 12,584 7,185,950 $ 0.030 0.033 .Smithfield city 9,150 4,836,647 $ 0.025 0.029 .South Ogden city 15,296 9,108,373 $ 0.021 0.023 .South Salt Lake city 19,177 24,069,159 $ 0.072 0.077
Cities and Towns with 5,000-19,999 Citizens
City
Population July, 2009
Total Government Revenue, 2009
SLIDE 7
Price of Government Price of Government Per Citizen Dollar Earned
Intergovernmental Monies Included .South Weber city 5,958 2,249,099 $ 0.013 0.016 .Tremonton city 6,445 7,486,262 $ 0.053 0.058 .Vernal city 8,282 11,437,886 $ 0.057 0.062 .Washington city 15,740 11,428,585 $ 0.033 0.036 .Washington Terrace city 8,185 6,229,844 $ 0.024 0.037 .West Bountiful city 5,237 3,321,562 $ 0.024 0.026 .West Haven city 7,317 3,573,916 $ 0.021 0.023 .West Point city 8,546 2,839,161 $ 0.011 0.014 .Woods Cross city 8,459 3,992,655 $ 0.020 0.022 Mean 9,948 11,184,501 $ 0.037 0.042 Median 8,185 5,304,793 $ 0.021 0.024
City
Population July, 2009
Total Government Revenue, 2009
SLIDE 8
Price of Government Price of Government Per Citizen Dollar Earned
Intergovernmental Monies Included .American Fork city 26,007 20,621,411 $ 0.037 0.039 .Bountiful city 43,008 20,339,265 $ 0.014 0.016 .Cedar City city 26,225 20,256,135 $ 0.036 0.046 .Clearfield city 26,509 15,969,162 $ 0.033 0.036 .Cottonwood Heights city 34,962 15,660,244 $ 0.011 0.013 .Draper city 36,469 39,683,026 $ 0.025 0.036 .Holladay city 25,000 13,583,434 $ 0.013 0.015 .Kaysville city 24,624 9,957,669 $ 0.015 0.016 .Layton city 64,117 30,408,301 $ 0.018 0.019 .Lehi city 41,680 37,455,260 $ 0.042 0.046 .Logan city 45,867 35,955,713 $ 0.038 0.045 .Midvale city 27,060 15,789,880 $ 0.024 0.028 .Murray city 45,406 38,152,301 $ 0.030 0.032 .Ogden city 80,688 67,847,399 $ 0.039 0.044 .Orem city 92,071 54,958,182 $ 0.028 0.030 .Pleasant Grove city 32,220 15,631,360 $ 0.021 0.023 .Provo city 106,820 62,788,825 $ 0.034 0.039 .Riverton city 37,036 18,774,477 $ 0.016 0.021 .Roy city 35,264 15,691,531 $ 0.018 0.021 .Salt Lake City city 176,100 217,247,666 $ 0.042 0.047 .Sandy city 94,943 66,595,400 $ 0.020 0.024 .South Jordan city 47,625 39,157,527 $ 0.027 0.029 .Spanish Fork city 28,948 13,992,375 $ 0.025 0.027 .Springville city 27,289 15,742,537 $ 0.026 0.030 .St. George city 68,735 84,361,289 $ 0.032 0.056 .Syracuse city 20,590 9,129,597 $ 0.017 0.020 .Taylorsville city 57,770 21,880,902 $ 0.037 0.066 .Tooele city 29,233 16,156,547 $ 0.024 0.028 .West Jordan city 101,394 57,512,735 $ 0.022 0.027 .West Valley City city 121,559 92,874,728 $ 0.038 0.042 Mean 54,174 39,472,496 $ 0.027 0.032 Median 39,358 21,251,157 $ 0.025 0.029
Cities and Towns with More than 20,000 Citizens
City
Population July, 2009
Total Government Revenue, 2009
SLIDE 9
Price of Government Price of Government Per Citizen Dollar Earned
Intergovernmental Monies Included
.Beaver County
5,912 12,916,493 $ 0.104 0.134
.Box Elder County
47,259 24,119,739 $ 0.020 0.025
.Cache County
107,095 38,966,946 $ 0.015 0.019
.Carbon County
18,886 26,837,770 $ 0.043 0.071
.Daggett County
702 5,608,869 $ 0.256 0.350
.Davis County
283,521 93,116,287 $ 0.011 0.013
.Duchesne County
15,997 21,130,946 $ 0.043 0.066
.Emery County
10,315 21,418,671 $ 0.070 0.111
.Garfield County
4,486 12,441,563 $ 0.066 0.117
.Grand County
9,337 13,524,298 $ 0.052 0.076 Iron County 41,513 23,818,215 $ 0.025 0.035
.Juab County
9,487 9,860,970 $ 0.031 0.058
.Kane County
6,248 13,895,160 $ 0.064 0.091 Millard County 11,931 18,668,981 $ 0.050 0.083
.Morgan County
8,381 5,938,166 $ 0.023 0.028
.Piute County
1,414 1,912,059 $ 0.047 0.084
.Rich County
2,063 3,343,403 $ 0.045 0.077
.Salt Lake County
986,397 504,868,148 $ 0.017 0.021 San Juan County 14,206 18,233,820 $ 0.040 0.092
.Sanpete County
22,972 12,032,473 $ 0.026 0.035
.Sevier County
18,987 21,753,757 $ 0.032 0.062
.Summit County
35,584 48,718,382 $ 0.028 0.035 Tooele County 52,943 39,413,105 $ 0.022 0.034
.Uintah County
28,836 32,843,537 $ 0.035 0.048
.Utah County
51,908 142,727,204 $ 0.113 0.144
.Wasatch County
20,236 24,878,059 $ 0.032 0.047
.Washington County
128,931 50,826,932 $ 0.009 0.018
.Wayne County
2,502 5,031,008 $ 0.049 0.102
.Weber County
219,267 106,153,262 $ 0.020 0.022 Mean 74,735 46,724,077 $ 0.020 0.027 Median 18,886 21,418,671 $ 0.035 0.062
Counties
County
Population July, 2009
Total Government Revenue, 2009
SLIDE 10
Price of Government Price of Government Per Capita
Intergovernmental Monies Included
Alpine School District 269,740 449,732,036 $ 0.029 0.087 Beaver County School District 6,267 14,752,987 $ 0.048 0.145 Box Elder School District 49,902 90,835,449 $ 0.028 0.090 Cache School District 61,239 113,372,544 $ 0.029 0.099 Carbon School District 19,989 37,241,856 $ 0.040 0.093 Daggett School District 941 3,900,999 $ 0.052 0.182 Davis School District 300,827 477,573,217 $ 0.019 0.063 Duchesne School District 17,948 40,702,186 $ 0.041 0.114 Emery School District 10,629 24,394,483 $ 0.054 0.122 Garfield School District 4,625 13,652,306 $ 0.043 0.124 Grand School District 9,660 17,288,811 $ 0.044 0.093 Granite School District 409,501 528,059,958 $ 0.016 0.052 Iron School District 45,280 72,104,140 $ 0.035 0.096 Jordan School District 155,974 636,789,153 $ 0.063 0.164 Juab School District 8,927 19,133,606 $ 0.043 0.121 Kane School District 6,601 15,253,526 $ 0.043 0.094 Logan School District 54,030 49,662,019 $ 0.016 0.049 Millard School District 12,276 32,279,487 $ 0.063 0.139 Morgan School District 8,908 17,604,650 $ 0.030 0.077 Murray City School District 39,300 52,000,012 $ 0.022 0.053 Nebo School District 119,387 219,913,249 $ 0.027 0.096 North Sanpete School District 11,081 20,914,882 $ 0.030 0.125 North Summit School District 5,294 12,491,325 $ 0.035 0.061 Ogden School District 91,164 114,042,954 $ 0.016 0.056 Park City School District 25,544 61,570,038 $ 0.054 0.062 Piute County School District 1,431 5,127,952 $ 0.039 0.224 Provo School District 156,180 115,372,843 $ 0.013 0.039 Rich School District 2,160 6,609,138 $ 0.068 0.145 Salt Lake City School District 209,225 255,854,654 $ 0.022 0.049 San Juan School District 15,049 44,197,165 $ 0.041 0.209 Sevier School District 19,976 39,639,780 $ 0.028 0.107 South Sanpete School District 14,865 30,954,174 $ 0.030 0.138 South Summit School District 6,131 18,777,084 $ 0.049 0.079 Tintic School District 1,317 4,318,158 $ 0.027 0.184 Tooele School District 58,335 106,452,146 $ 0.025 0.083 Uintah School District 31,536 63,096,925 $ 0.039 0.084 Wasatch School District 21,600 47,217,329 $ 0.045 0.084 Washington School District 27,138 214,728,980 $ 0.155 0.368 Wayne School District 2,601 6,337,002 $ 0.027 0.123 Weber School District 140,670 220,534,327 $ 0.019 0.070 Mean 61,331 107,862,088 $ 0.028 0.078 Median 19,983 42,449,676 $ 0.035 0.095
School Districts
School District
Population July, 2009
Total Government Revenue, 2009
SLIDE 11
Price of Government Price of Government Per Capita
Intergovernmental Monies Included Utah 2,651,816 9,307,933,000 $ 0.100 0.15 Total: 0.179 City (Average) 0.020 0.028 0.031
State
State
Population July, 2009
Total Government Revenue, 2009
Summary
Taxing Entity
Price of Government Per Capita
0.100 State of Utah County (Average) School District (Average)