SLIDE 1 Chart 1
Jan-59 Jan-65 Jan-71 Jan-77 Jan-83 Jan-89 Jan-95 Jan-01 Jan-07 Jan-13 2% 4% 6% 8% 10% 12% 14% 16% 50% 60% 70% 80% 90% 100% 110% 120% 130% 140% Saving Rate (SAAR) - left axis Household Debt as a % of Disposable Personal Income - right axis
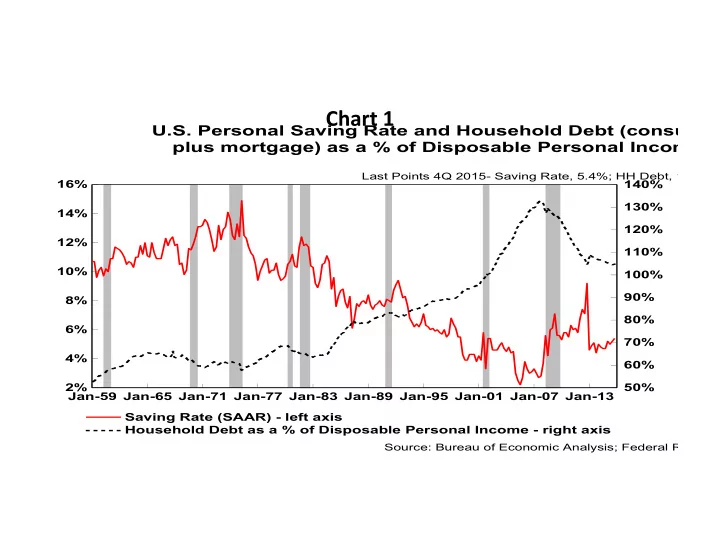
U.S. Personal Saving Rate and Household Debt (consumer plus mortgage) as a % of Disposable Personal Income
Last Points 4Q 2015- Saving Rate, 5.4%; HH Debt, 104.7% Source: Bureau of Economic Analysis; Federal Reserve
SLIDE 2 Chart 2
Real GDP Growth During Expansions
annualized rates of expansion from NBER trough-to-peak
*Through 1Q 2016 Source: BEA, NBER
7.6% 4.0% 5.6% 4.9% 5.1% 4.3% 4.4% 4.3% 3.6% 2.8% 2.1%* 1950 1954 1958 1961 1971 1975 1980 1983 1991 2002 2009 0% 1% 2% 3% 4% 5% 6% 7% 8% 0% 1% 2% 3% 4% 5% 6% 7% 8%
Recession Start Date
SLIDE 3 Chart 3
Eurozone Real GDP Growth
Source: eurostat Last Point 1Q 2016: Q/Q, 2.2%; Y/Y, 1.6%
2007 2008 2009 2010 2011 2012 2013 2014 2015
- 12.0%
- 10.0%
- 8.0%
- 6.0%
- 4.0%
- 2.0%
0.0% 2.0% 4.0% 6.0%
- 12.0%
- 10.0%
- 8.0%
- 6.0%
- 4.0%
- 2.0%
0.0% 2.0% 4.0% 6.0% quarter/quarter % change, seas. adj. annual rates year/year % change
SLIDE 4 Chart 4
Japanese Real GDP Growth
Source: Japanese Cabinet Office Last Points 4Q 2015: Q/Q, -1.1%; Y/Y, 0.8%
2007 2008 2009 2010 2011 2012 2013 2014 2015
0% 5% 10% 15%
0% 5% 10% 15% quarter/quarter % change, seas. adj. annual rates year/year % change
SLIDE 5 Chart 5
Jan-07 Sep-08 May-10 Jan-12 Sep-13 May-15
0% 50% 100% 150% 200% 250% 300% 350% 400% 450%
0% 50% 100% 150% 200% 250% 300% 350% 400% 450% Federal Reserve European Central Bank Bank of England Bank of Japan
Central Bank Assets
change since January 2007
Source: Bloomberg; The Central Banks Last Points: April 2016
SLIDE 6
Chart 6
Jan-07 Dec-08 Dec-10 Dec-12 Dec-14 600 800 1000 1200 1400 1600 1800 2000 2200 600 800 1000 1200 1400 1600 1800 2000 2200
S&P 500 Index
Source: Thomson Reuters Last Point 05/12/16: 2,064.11
SLIDE 7 Chart 7
2010 2011 2012 2013 2014 2015 2016 2017 2018 1.0% 1.5% 2.0% 2.5% 3.0% 3.5% 4.0% 4.5% 1.0% 1.5% 2.0% 2.5% 3.0% 3.5% 4.0% 4.5% Actual Real GDP 2011 2012 2013 2014 2015
Historical Fed Committee Forecasts for Real GDP Growth
based on central tendency midpoint forecast at first FED meeting of the year
Source: Federal Reserve Note: Longer run forecast used for 2018 forecast made in 2015.
SLIDE 8 Chart 8
1947-I 1959-III 1972-I 1984-III 1997-I 2009-III 58% 59% 60% 61% 62% 63% 64% 65% 66% 67% 68% 7% 8% 9% 10% 11% 12% 13% 14% 15% Compensation of Employees - left axis
- Corp. Profits with IVA and CCAdj - right axis
Corporate Profits and Employee Compensation as a percentage of National Income
Source: Bureau of Economic Analysis Last Points 4Q 2015 - Corp. Profits: 12.1%, Employee Comp: 62.6%
SLIDE 9 Chart 9
1980 1985 1990 1995 2000 2005 2010
0% 1% 2% 3% 4%
0% 1% 2% 3% 4%
- Avg. Real Weekly Wages of Production and Supervisory Employees
Real Median Household Income
Real Weekly Wages and Household Incomes
year/year percent changes
Source: Bureau of Labor Statistics; Census Bureau Last Points 2014- Income: -1.5%, Wages: 1.0%
SLIDE 10
Chart 10
Jan-48 Jan-57 Jan-66 Jan-75 Jan-84 Jan-93 Jan-02 Jan-11 58% 59% 60% 61% 62% 63% 64% 65% 66% 67% 68% 58% 59% 60% 61% 62% 63% 64% 65% 66% 67% 68%
Labor Force Participation Rate
Source: Bureau of Labor Statistics Last Point April 2016: 62.8%
SLIDE 11 Chart 11
Retail Sales
retail trade and food services
Source: U.S. Census Bureau Last Point April 2016: M/M, 1.3%; Yr/Yr, 3.0%
Jan-15 Mar-15 May-15 Jul-15 Sep-15 Nov-15 Jan-16 Mar-16
0.0% 0.5% 1.0% 1.5%
0.0% 1.0% 2.0% 3.0% 4.0% Month/Month Percent Change - left axis Year/Year Percent Change - right axis
SLIDE 12
Chart 12
1992 1994 1996 1998 2000 2002 2004 2006 2008 2010 2012 2014 4% 6% 8% 10% 12% 14% 16% 4% 6% 8% 10% 12% 14% 16%
Chinese Real Gross Domestic Product
year/year percent change
Last Point 1Q 2016: 6.7% Source: Bloomberg; Chinese National Bureau of Statistics
SLIDE 13 Chart 13
Jan-07 Sep-08 May-10 Jan-12 Sep-13 May-15
0% 10% 20% 30% 40% 50% 60%
0% 10% 20% 30% 40% 50% 60%
Chinese Exports
year/year percent change
Source: China General Administration of Customs Last Point April 2016: -1.8%
SLIDE 14
Chart 14
2004 2006 2008 2010 2012 2014 150% 160% 170% 180% 190% 200% 210% 220% 230% 240% 250% 150% 160% 170% 180% 190% 200% 210% 220% 230% 240% 250%
Chinese Total Debt as a Share of GDP
includes corporate, household, government and bank debt
Source: Bloomberg Last Point 2015: 246.8%
SLIDE 15 Chart 15
1997 1999 2002 2004 2007 2009 2012 2014 11.5% 12.0% 12.5% 13.0% 13.5% 14.0% 14.5% 15.0% 15.5% 16.0% 16.5% 17.0% 11.5% 12.0% 12.5% 13.0% 13.5% 14.0% 14.5% 15.0% 15.5% 16.0% 16.5% 17.0%
United States Manufacturing Value Added
as % share of GDP
Source: Bureau of Economic Analysis; The World Bank Last Point 4Q 2015: 12.0%
SLIDE 16
Chart 16
G7 and BRIC Personal Consumption to GDP Ratio: 2014
68.6% 64.7% 62.5% 61.1% 61.1% 59.3% 55.9% 55.8% 55.5% 53.0% 36.5% 30% 35% 40% 45% 50% 55% 60% 65% 70% 75% U.S. U.K. Brazil Japan Italy India Germany Canada France Russia China
Source: The World Bank
SLIDE 17
Chart 17
Jan-15 Mar-15 May-15 Aug-15 Oct-15 Dec-15 Mar-16 150 160 170 180 190 200 210 220 230 240 25 30 35 40 45 50 55 60 65 CRB Index - left axis WTI Crude Oil (dollars per barrel) - right axis
Reuters/Jeffries CRB Index and WTI Crude Oil
Source: Thomson Reuters Last Points 05/12/16- CRB: 184.39; WTI: $46.70
SLIDE 18 Chart 18
Jan-07 Sep-08 May-10 Jan-12 Sep-13 May-15 20 40 60 80 100 120 140 160 180 200 5000 10000 15000 20000 25000 30000 35000 40000 45000 50000 Iron Ore - left axis Nickel - right axis
Iron Ore and Nickel
$ per tonne
Source: Thomson Reuters; Bloomberg Last Point 05/12/16: Iron Ore, $54.50; Nickel, $8,775
SLIDE 19
Chart 19
1774 1814 1854 1894 1934 1974 2014 200 400 600 800 1000 1200 1400 200 400 600 800 1000 1200 1400
Real U.S. Commodity Prices
CRB Index Deflated by CPI
Source: Bianco Research, Bureau of Labor Statistics, Historical Statistics of the Un Last Point March 2016: 72.15
SLIDE 20 Chart 20
Mar-07 Jun-08 Sep-09 Dec-10 Mar-12 Jun-13 Sep-14 Dec-15
0% 5% 10%
0% 5% 10% Brazil GDP Russia GDP
Brazil and Russia Real GDP Growth
year/year percent change
Source: Brazil Institute of Geography and Statistics; Bloomberg Last Points 4Q 2015: Brazil, -5.9%; Russia, -3.8%
SLIDE 21
Chart 21
1996 1998 2001 2003 2006 2008 2011 2013 25 30 35 40 45 50 55 60 25 30 35 40 45 50 55 60 Non-OPEC OPEC
Total Oil Output for Non-OPEC and OPEC Countries
million barrels per day
Source: Energy Information Administration Last Points 3Q 2015 - Non-OPEC: 58.68; OPEC: 37.71
SLIDE 22
Chart 22
United States Crude Oil Production
million barrels per day
Source: Energy Information Administratio Last Points 05/6/16: 8.80
2000 2001 2002 2004 2005 2006 2008 2009 2010 2012 2013 2014 1 2 3 4 5 6 7 8 9 10 1 2 3 4 5 6 7 8 9 10
SLIDE 23 Chart 23
Crude Oil Rotary Rig Count and Average Oil Production Per Rig
Source: Bloomberg; Baker Hughes Last Points April 2016: Rigs, 372; Oil Prod., 475
2008 2009 2010 2011 2012 2013 2015 200 400 600 800 1000 1200 1400 1600 50 100 150 200 250 300 350 400 450 500 Rig Count - left axis Average Oil Production Per Rig (barrels/day) - right axis
SLIDE 24 Chart 24
Oil Breakeven Price for Major Petrostates
$ per barrel
Source: Bloomberg; The Wall Street Journal
$52 $58 $68 $70 $76 $89 $93 $96 $98 $105 $208 Kuwait Qatar U.A.E. Iran Iraq Venezuela Algeria Saudi Arabia Oman Bahrain Libya $0 $50 $100 $150 $200 $250 $0 $50 $100 $150 $200 $250 *Breakeven price needed in order to balance the national budget.
Current Brent Crude, $/barrel: $48.08
SLIDE 25 Chart 25
OPEC Oil Output By Country
million barrels per day
Source: Bloomberg Last Point: April 2016
10.3 4.3 3.5 3.0 2.9 2.4 1.8 1.7 1.1 0.7 0.7 0.6 0.3 Saudi Arabia Iraq Iran U.A.E. Kuwait Venezuela Angola Nigeria Algeria Indonesia Qatar Ecuador Libya 2 4 6 8 10 12 2 4 6 8 10 12
SLIDE 26 Chart 26
2001 2002 2004 2006 2007 2009 2011 2012 2014 2016 100 200 300 400 500 600 700 800 100 200 300 400 500 600 700 800
Saudi Arabia Foreign Exchange Reserves
billion USD
Source: Bloomberg; International Monetary Fund Last Point March 2016: $587.08
SLIDE 27 Chart 27
A Successful Cartel
1. Involves a commodity that can otherwise be left in the ground, avoiding production and inventory costs until it’s needed.
- 2. Its product is so much in demand that buyers are relatively insensitive to price.
- 3. The commodity has few if any close substitutes.
- 4. It includes most of the low-cost suppliers and has few meaningful non-cartel competitors.
- 5. It involves relatively few cartel members, thereby promoting discipline.
6. It's sponsored by governments and even religious authorities that benefit from the cartel and protect it.
- 7. It operates in a period of strong economic growth and robust demand for the product.
- 8. It faces few technological improvements in the industry.
SLIDE 28 Chart 28
Unfavorable Climate for OPEC
1. Alternatives to oil, especially natural gas but also government-subsidized renewables, are growing.
- 2. Non-OPEC supplies are leaping, notably from Russia and especially American frackers.
- 3. Infighting among OPEC members has destroyed discipline.
- 4. Global economic growth is weak, and the ongoing shift from goods production to services in
China and elsewhere is curbing oil demand.
- 5. Conservation is limiting oil demand.
- 6. Rapid technological advances in fracking, horizontal drilling, deep-water and Arctic drilling, etc.
are mushrooming non-OPEC supplies at low and declining costs.
SLIDE 29 Chart 29
Annual Average Oil Demand for OECD and Non-OECD Countries
million barrels per day
Source: The Wall Street Journal; Bloomberg Last Points 2015: OECD, 46.39; Non-OECD, 48.28
2006 2007 2008 2009 2010 2011 2012 2013 2014 2015 10 20 30 40 50 60 10 20 30 40 50 60 OECD Non-OECD
SLIDE 30 Chart 30
World Crude Oil Supply and Demand
million barrels per day
Source: Bloomberg; International Energy Agency Last Points 4Q 2015: Ex. Supply, 1.7; Demand, 95.5; Suppl
2001 2002 2003 2004 2006 2007 2008 2009 2011 2012 2013 2014
0.0 0.5 1.0 1.5 2.0 2.5 75 80 85 90 95 100 Excess Supply - left axis Demand - right axis Supply - right axis
SLIDE 31 Chart 31
Commercial Crude Oil Inventory
weekly U.S. ending stocks
Source: Energy Information Administratio Last Points 05/6/16: Inventory: 539.9; Yr/Yr: 10.9%
Jan-14 Apr-14 Aug-14 Dec-14 Mar-15 Jul-15 Nov-15 200 250 300 350 400 450 500 550
0% 5% 10% 15% 20% 25% 30% Crude Oil Inventory (million barrels) - left axis Year/Year Percent Change - right axis
SLIDE 32 Chart 32
Mar-11 Oct-11 May-12 Dec-12 Jul-13 Feb-14 Sep-14 Apr-15 Nov-15 20% 30% 40% 50% 60% 70% 80% 90% 20% 30% 40% 50% 60% 70% 80% 90% Tank Net Available Shell Storage Capacity Utilization Tank Working Storage Capacity Utilization
Crude Oil Storage Capacity Utilization
Cushing, OK
Source: Energy Information Administratio Last Points 05/6/16: Shell, 77.3%; Working, 92. Note: Net available shell includes idle (not working) capacity.
SLIDE 33
Chart 33
Jun-16 Feb-18 Oct-19 Jun-21 Feb-23 Oct-24 46 48 50 52 54 56 58 46 48 50 52 54 56 58
Source: Bloomberg
WTI Crude Oil Futures Curve
05/12/16 close prices; dollars per barrel
SLIDE 34 Chart 34
Total Crude Oil Storage in Amsterdam-Rotterdam-Antwerp Region
million barrels
Source: Bloomberg Last Point 05/6/2016: 55.79
Feb-13 Jun-13 Oct-13 Feb-14 Jun-14 Oct-14 Jan-15May-15Sep-15 Jan-16 40 45 50 55 60 65 40 45 50 55 60 65
SLIDE 35 Chart 35
Jan-15 Mar-15 May-15 Jul-15 Oct-15 Dec-15 Feb-16 May-16 6.15 6.20 6.25 6.30 6.35 6.40 6.45 6.50 6.55 6.60 6.15 6.20 6.25 6.30 6.35 6.40 6.45 6.50 6.55 6.60
Chinese Yuan Per U.S. Dollar
Source: Bloomberg Last Point 05/12/16: 6.514
Stronger U.S. Dollar
08/11/15: People's Bank of China lowers yuan reference rate
Stronger U.S. Dollar
SLIDE 36 Chart 36
Chinese Trade Balance and Capital Flow
billion USD
Source: Bloomberg Last Points 03/16: Cap. Flow, -$44.3; 04/16: Balance, $45.56
Jan-10 Sep-10 May-11 Jan-12 Sep-12 May-13 Jan-14 Sep-14 May-15
50 100 150
10 30 50 70 Monthly Capital Flow - left axis Trade balance - right axis
SLIDE 37
Chart 37
Jan-00 Sep-01 May-03 Jan-05 Sep-06 May-08 Jan-10 Sep-11 May-13 Jan-15 500 1000 1500 2000 2500 3000 3500 4000 500 1000 1500 2000 2500 3000 3500 4000
Chinese Foreign Exchange Reserves
billion USD
Source: Bloomberg Last Point April 2016: $3,219.67
SLIDE 38 Chart 38
Dec-13 May-14 Oct-14 Feb-15 Jul-15 Dec-15 Apr-16 2.0 2.2 2.4 2.6 2.8 3.0 3.2 3.4 3.6 3.8 4.0 4.2 30 35 40 45 50 55 60 65 70 75 80 85 BRL/USD - left axis RUB/USD- right axis
Brazilian Real and Russian Ruble Exchange Rates
Last Points 05/12/16: Real: 3.485; Ruble: 64.711 Source: Thomson Reuters
Stronger U.S. Dollar Stronger U.S. Dollar
SLIDE 39 Chart 39
Mexican Peso and WTI Crude Oil
Source: Thomson Reuters Last Points 05/12/16 - Pesos/$:17.964; WTI: $46.70
Jan-14 May-14 Oct-14 Feb-15 Jul-15 Dec-15 Apr-16 12.0 13.0 14.0 15.0 16.0 17.0 18.0 19.0 20.0 20 30 40 50 60 70 80 90 100 110 Mexican Pesos per U.S. Dollar - left axis WTI Crude Oil ($/barrel) - right axis
Stronger U.S. Dollar
SLIDE 40 Chart 40
Jul-12 Apr-13 Jan-14 Oct-14 Jul-15 May-16 1.00 1.05 1.10 1.15 1.20 1.25 1.30 1.35 1.40 75 80 85 90 95 100 105 110 115 120 125 130 USD/EUR - left axis (inverted) JPY/USD - right axis
Euro and Yen Exchange Rates
Last Points 05/12/16 - USD/EUR: 1.138; JPY/USD: 109.01 Source: Thomson Reuters
Stronger U.S. Dollar Stronger U.S. Dollar
SLIDE 41 Chart 41
Jan-14 Jun-14 Nov-14 Apr-15 Sep-15 Feb-16
0% 1% 2% 3% 4% 5%
0% 1% 2% 3% 4% 5% United States Eurozone Japan
Producer Price Index
year/year percent change
Source: Bloomberg; Bureau of Labor Statistics Last Points 04/16: U.S., 0.0%; 03/16: Japan, -3.8%; EZ, -4.2%
SLIDE 42 Chart 42
Chinese Producer Price Index
Source: Bloomberg Last Points April 2016: M/M, 0.7%; Yr/Yr, -3.4%
Jan-11 Jul-11 Jan-12 Jul-12 Jan-13 Jul-13 Jan-14 Jul-14 Jan-15 Jul-15 Jan-16
0.0% 0.5% 1.0% 1.5%
0.0% 2.0% 4.0% 6.0% 8.0% Month/Month Percent Change - left axis Year/Year Percent Change - right axis
SLIDE 43 Chart 43
Jan-07 Sep-08 May-10 Jan-12 Sep-13 May-15
0% 1% 2% 3% 4% 5% 6%
0% 1% 2% 3% 4% 5% 6% Goods Services
U.S. Personal Consumption Expenditures Implicit Price Deflator
year/year percent change
Source: Bureau of Economic Analysis Last Points March 2016 - Goods: -1.8%; Services: 2.1%
SLIDE 44 Chart 44
PCE Deflator
seasonally-adjusted
Source: Bureau of Economic Analysis Last Point March 2016 - M/M: 0.1%; Y/Y: 0.8%
2007 2008 2009 2010 2011 2012 2013 2014 2015
0.0% 0.5% 1.0%
0.0% 3.0% 6.0% Month/Month % Change - left axis Year/Year % Change - right axis
Fed Target: 2.0%
SLIDE 45 Chart 45
Japanese CPI and Real GDP
year/year percent change
Source: Japanese Cabinet Office Last Points 4Q 2015- GDP: 0.8%; CPI: 0.3%
1981 1985 1989 1993 1997 2001 2005 2009 2013
0% 2% 4% 6% 8% 10%
0% 2% 4% 6% 8% 10% Real GDP Consumer Price Index
SLIDE 46 Chart 46
Investment Themes
- 1. Short commodities
- 2. Short crude oil and related securities
- 3. Long the dollar vs. euro and yen, commodity currencies and developing
economy currencies
- 4. Short emerging market stocks and bonds
- 5. Short junk bonds
- 6. Long 30-year Treasuries
- 7. Short U.S. stocks
SLIDE 47 Chart 47
10-Year Sovereign Bond Yields
as of 05/12/16 Source: Financial Times
Country Yield Spread vs. Treasurys
Switzerland
Japan
Germany 0.13
Netherlands 0.21
Denmark 0.37
Finland 0.42
France 0.48
Austria 0.52
Belgium 0.52
Ireland 0.86
Canada 1.30
Norway 1.31
United Kingdom 1.53
Italy 1.54
Spain 1.59
United States 1.75
2.43 0.68 Portugal 3.27 1.52 Greece 7.39 5.64
SLIDE 48 Chart 48
Oct-81 Oct-86 Oct-91 Oct-96 Oct-01 Oct-06 Oct-11 5000 10000 15000 20000 25000 30000 35000 5000 10000 15000 20000 25000 30000 35000 25 Year Zero Coupon Bond (Oct-81=100) 28,666 or 17.8% Annual Return S&P 500 Total Return (July-82=100) 4,527 or 12.0% Annual Return
Comparative Stock and Bond Performances
Last Points April 2016 - Stocks: 4,527; Bonds: 28,666 Source: Bianco Research & Haver Analytics