chapter 13 mass spectrometry and infrared spectroscopy
play

Chapter 13: Mass Spectrometry and Infrared Spectroscopy A. - PDF document

13-1 Chapter 13: Mass Spectrometry and Infrared Spectroscopy A. Spectroscopic AnalysisTools for Structure Determination We have seen many organic structures, but we have not discussed how we can figure out what these structures are .


  1. 13-1 Chapter 13: Mass Spectrometry and Infrared Spectroscopy A. Spectroscopic Analysis—Tools for Structure Determination We have seen many organic structures, but we have not discussed how we can figure out what these structures are . Naturally, the ability to analyze a sample in the lab for its identity and purity is essential . We have powerful tools that provide info about structure, but often only indirectly—one must know how to interpret the data . Two such techniques will be introduced in this Chapter: 1. Mass spectrometry—info about MW and/or formula 2. Infrared spectroscopy—info about functional groups present 13-2 B. Mass spectrometry (MS) • MS enables measurement of the molecular weight (MW) and, sometimes, the formula of a compound. • 
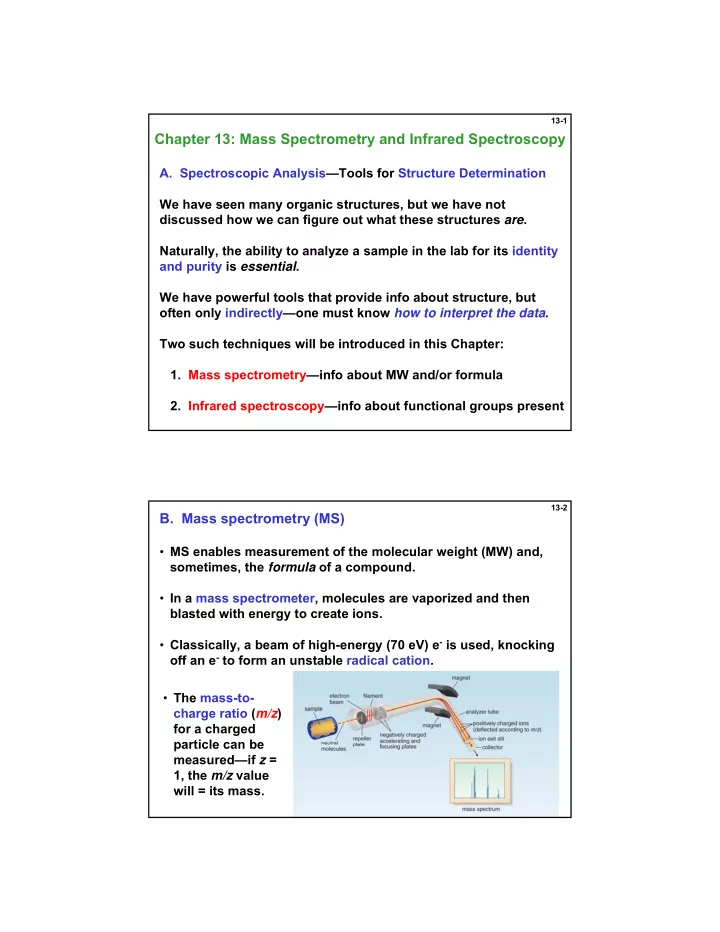
In a mass spectrometer, molecules are vaporized and then blasted with energy to create ions. • Classically, a beam of high-energy (70 eV) e - is used, knocking off an e - to form an unstable radical cation. • The mass-to- charge ratio ( m/z ) for a charged particle can be measured—if z = 1, the m/z value will = its mass.

  2. 13-3 1. A “Mass Spectrum” (plural = spectra) • The radical cation initially formed is M +• --called the molecular ion or parent ion. Its m / z represents the MW of M. • M +• is unstable, and decomposes to form fragments smaller than M +• . Some of these are also charged, resulting in an array of ions called a mass spectrum. • All charged species formed can be analyzed/observed— generally, the focus is on + ions. 13-4 An Example: the Mass Spectrum of n -Hexane (MW 86) • A small M+1 peak ( m/z 87) accompanies M +. . This is called an “isotope peak” and is mainly due to the small 1.1% natural abundance of 13 C!! + ). • The tallest peak (= most abundant ion) is at m/z 57 (C 4 H 9 This is the “base peak” (such “fragment” ions may be more abundant than M +. if they are more stable than M +. ). • Other major ions occur at m/z 43 (C 3 H 7 + ) and 29 (C 2 H 5 + ). The array of ions observed is called the “fragmentation pattern”, and is characteristic of the structure.

  3. 13-5 2. Halides and M + 2 Ions—More “Isotope Peaks” Most elements have one major isotope ( 1 H, 12 C, 14 N, 16 O, etc.) Cl has two ; 35 Cl and 37 Cl, which occur naturally in a 3:1 ratio. • The M peak contains 35 Cl. The M + 2 peak, corresponds to the molecules that contain 37 Cl. • Thus, the presence of molecular ion M and M + 2 peaks in a 3:1 ratio is diagnostic for the presence of Cl (e.g., in RCl). Br also has two; 79 Br and 81 Br, occurring in a ratio of ~ 1:1. • So….when the M +. range consists of M and M + 2 peaks in a 1:1 ratio, a Br atom is likely to be present. 13-6 Examples: MS Data for 2-Chloropropane and 2-Bromopropane • Most fragments here do not have the M + 2 partner because the Cl or Br has been lost in getting to them. • MS provides a good way to determine whether a compound has Cl or Br in it. • Note: the “atomic wt” for an element in the periodic table is a weighted average of the natural isotopes

  4. 13-7 3. Fragmentations Useful in Structure Analysis Some of the fragment ions observed in a spectrum may be useful in elucidating further details about the structure. We will not explore this in depth, but two examples follow: Alcohols often undergo a loss of H 2 O in MS--dehydration: Utility? The presence of a sizable M-H 2 O ion in a mass spectrum suggests that the compound contains an alcohol group. 13-8 Another common type of fragmentation is called  -cleavage. This process occurs for many functional groups, and involves a relatively favorable cleavage of a bond “  ” to a heteroatom: e.g., for alcohols: Utility? The resulting M-R ion(s) can tell you the size of R Carbonyl compounds can do this, too: Utility? as above--tells size of R

  5. 13-9 4. High Resolution Mass Spectrometry (HRMS) • Low resolution MS gives m/z values to the nearest whole number. • High resolution MS gives m/z values to four (or more) decimal places. • Except for 12 C (mass = 12.0000 daltons by convention), the masses of all other nuclei are not exactly whole numbers. • Therefore, using the exact mass values of possible nuclei, HRMS data can be used to determine the molecular formula of an ion. Exact masses of possible formulas for Exact masses of some m/z 60; HRMS will tell which you have! common isotopes: 13-10 5. Gas Chromatography-Mass Spectrometry (GCMS) • MS can be combined with gas chromatography (GC) to analyze mixtures . A gas chromatograph is a fancy oven housing a thin capillary column containing a viscous high-boiling material. • Sample is injected, vaporized, and swept by an inert gas through the column. Lower boiling compounds travel faster, and exit the column (“elute”) before higher boiling ones.

  6. 13-11 • A gas chromatogram (or “GC trace”) of the mixture is recorded--a plot of peak intensity of each component vs. its retention time (the time required to travel through the column). • Each component then enters the MS where it is ionized to form M +. and fragment ions. • GCMS data for a three-component mixture are shown below. 13-12 GCMS Analysis in Drug Screening • To analyze a urine sample for THC, the main active component of marijuana, a urine extract is made and analyzed by GCMS. • If THC is present, it appears as a GC peak with a retention time matching that of THC, and a mass spectrum with an M +. at m/z 314 (the MW of THC) and a matching fragmentation pattern. • The size/area of the GC peak would be related to the amount present.

  7. 13-13 C. The Electromagnetic Spectrum: More Tools for Structure Analysis • The electromagnetic spectrum is divided into different regions, ranging from gamma rays to radio waves. Light visible to the human eye occupies only a small fraction. Scale of these wavelengths: 13-14 Electromagnetic radiation has properties of both waves and particles. It is characterized by wavelength (  ) and frequency (  ) • Wavelength is the distance from one point on a wave to the analogous point on the next wave. • Frequency is the # of waves passing per unit time. It is reported in cycles per second (s − 1 ), also known as hertz (Hz). • The energy ( E ) of a photon is proportional to its frequency (  ); E = h  , where h = Planck’s constant • E and  are inversely proportional: E = h  = hc/ 

  8. 13-15 Absorption of Electromagnetic Radiation • When radiation hits a molecule, some wavelengths, but not all, will be absorbed. Which? Depends on the structure… • For absorption to occur, the energy must match the  E between two energy states in the molecule • The larger the  E between two states, the higher the energy of radiation needed for absorption to occur. • Ultraviolet (UV)-visible light causes electronic excitation (Ch. 16) • Infrared (IR) light causes vibrational excitation... 13-16 D. Infrared (IR) Spectroscopy • Absorption of IR light causes changes in the vibrational motions of a molecule. • The various vibrational modes available to a molecule include bond-stretching and bending modes. • Different kinds of bonds vibrate at different frequencies… • These frequencies fall in the IR range (4000 to 400 cm − 1 ).

  9. 13-17 • In an IR spectrophotometer, IR light is passed through a sample. • Some is absorbed (at relevant vibrational frequencies), and the remainder is transmitted to a detector. • An IR spectrum is a plot of the % transmitted light vs. frequency, which, in IR spectra, is given in wavenumbers (cm -1 ). Use of wavenumbers (cm -1 ) is annoying, but is standard in IR. Wavenumber is not the same as wavelength— its a frequency term ( inverse of wavelength) 13-18 E. Bonds and IR Absorption • Where a bond absorbs in the IR depends on the bond strength and the mass of the atoms involved. • Different bond types absorb in different regions—the most diagnostic absorptions are associated with bond stretching . • A potentially useful analogy involves thinking of bonds as springs with weights on each end: • Stronger bonds (i.e., triple > double > single) vibrate at a higher frequency (higher wavenumbers). • Bonds with lighter atoms also vibrate at higher frequency (higher wavenumbers).

  10. 13-19 • Most organics have many single bonds, so IR regions associated with these e.g., the “fingerprint region”) are often a mess . • However, absorptions of functional groups (multiple bonds, O-H, N-H) stand out  more useful . 13-20 Some IR absorption ranges of note: particularly diagnostic particularly diagnostic Consider how the difference in C-H absorption ranges correlates with what we know about % s -character & bond strength.

  11. 13-21 Some Examples of IR Spectra: 21 13-22 F. IR and Structure Determination • IR does not provide a lot of detailed info, but can be helpful, e.g., as a quick means of confirming the outcome of a reaction. • For example, the IR spectrum of the product below would not show an OH absorption, but would contain a C=O absorption.

Download Presentation
Download Policy: The content available on the website is offered to you 'AS IS' for your personal information and use only. It cannot be commercialized, licensed, or distributed on other websites without prior consent from the author. To download a presentation, simply click this link. If you encounter any difficulties during the download process, it's possible that the publisher has removed the file from their server.

Recommend


More recommend