CFD modeling for validation of the 1/7 th scale steam generator inlet - - PDF document

cfd modeling for validation of the 1 7 th scale steam
SMART_READER_LITE
LIVE PREVIEW

CFD modeling for validation of the 1/7 th scale steam generator inlet - - PDF document

Transactions of the Korean Nuclear Society Virtual Spring Meeting July 9-10, 2020 CFD modeling for validation of the 1/7 th scale steam generator inlet plenum mixing experiment Kukhee Lim a * , Cheongryul Choi b , Dae Kyung Choi b , Yong Jin Cho a


slide-1
SLIDE 1

CFD modeling for validation

  • f the 1/7th scale steam generator inlet plenum mixing experiment

Kukhee Lima*, Cheongryul Choib, Dae Kyung Choib, Yong Jin Choa

aKorea Institute of Nuclear Safety, 62 Gwahak-ro, Yuseong-gu, Daejeon, Korea 34142 bELSOLTEC., #1401-2, U-Tower BD. 184, Jungbu-daero, Giheung-gu, Yongin-si, Gyeongi-do, 17095 * Corresponding author: limkh@kins.re.kr

  • 1. Introduction

Steam generated from the reactor core is transferred to the steam generator through the RCS hot leg during severe accident scenarios with high-pressure. If the RCS cold leg loop seal blocks the steam, the count-current flow through the steam generator tubes and hot leg is

  • generated. The heat of hot steam is transferred to the

secondary system via the steam generator and the cooled steam with high density flows through the lower part of the hot leg. If the reactor vessel is maintained intact with high pressure, the possibility of creep rupture of the hot leg, pressurize surge line and steam generator tubes

  • increases. If the steam generator tubes are failed earlier

than the failures of the other parts, these scenarios are termed consequential steam generator tube rupture (C- SGTR) [1]. The mixing fraction of steam in the inlet plenum of steam generator affects significantly to the thermal loads to the steam generator tubes. Westinghouse 1/7th scale experiments have been performed to simulate the natural circulation with the steam generator [2]. In order to apply the lessons of the experiments to the reactor cases, one

  • f the experiments was validated using CFD with the

assumptions of simplified porous tube bundle modeling and small number of mesh [3]. Therefore, it is required to validate the experiment with less modeling

  • assumptions. In this study, the experiment is validated

with full tube bundle modeling without simplification. And the effect of the hot leg modeling in CFD has been in investigated.

  • 2. Modeling

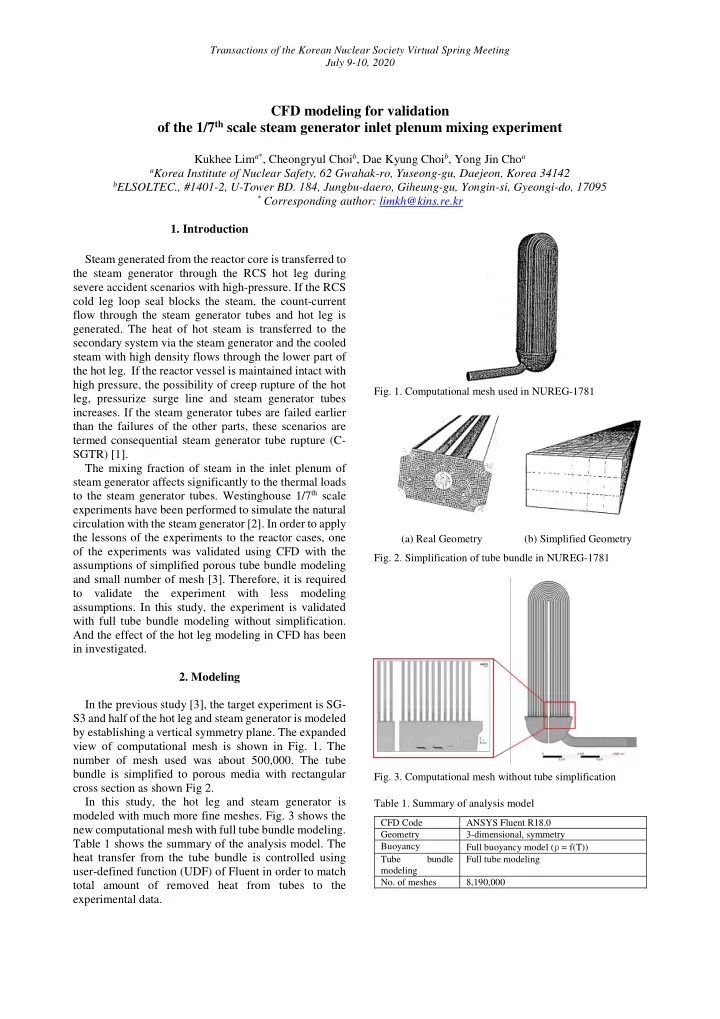
In the previous study [3], the target experiment is SG- S3 and half of the hot leg and steam generator is modeled by establishing a vertical symmetry plane. The expanded view of computational mesh is shown in Fig. 1. The number of mesh used was about 500,000. The tube bundle is simplified to porous media with rectangular cross section as shown Fig 2. In this study, the hot leg and steam generator is modeled with much more fine meshes. Fig. 3 shows the new computational mesh with full tube bundle modeling. Table 1 shows the summary of the analysis model. The heat transfer from the tube bundle is controlled using user-defined function (UDF) of Fluent in order to match total amount of removed heat from tubes to the experimental data.

  • Fig. 1. Computational mesh used in NUREG-1781

(a) Real Geometry (b) Simplified Geometry

  • Fig. 2. Simplification of tube bundle in NUREG-1781
  • Fig. 3. Computational mesh without tube simplification

Table 1. Summary of analysis model

CFD Code ANSYS Fluent R18.0 Geometry 3-dimensional, symmetry Buoyancy Full buoyancy model (ρ = f(T)) Tube bundle modeling Full tube modeling

  • No. of meshes

8,190,000

Transactions of the Korean Nuclear Society Virtual Spring Meeting July 9-10, 2020

slide-2
SLIDE 2
  • 3. Analysis results

The main purpose of the validation in this study is to match the number of hot and cold tubes and mixing fraction by simulating the behavior of fluid at the steam generator inlet plenum and tube bundle appropriately. The analysis conditions of the base case and 33 sensitivity cases are summarized in Table 2. The base case is selected based on the analysis conditions of NUREG-1781.

Table 2. Range of case studies

Time transient, steady Turbulence model Reynolds stress, standard k-ε, k-ω SST, Target heat transfer rate at the tube bundle 890, 1780, 2670 and 3560 W (25, 50, 75 and 100 %) Heat transfer coefficient from the tube bundle 250 W/m2∙K (fixed) or UDF controlled Tube wall toughness 0 - 0.001 m Secondary side temperature (tube wall) 324.55 - 337. 85 K Inlet velocity 0.07315 - 0.1045 m/s

* Items in bold are conditions of the base case.

The analysis results are compared to the experimental data and previous analysis results with respect to the following variables;

  • Heat loss at tubes
  • Number of hot and cold tubes
  • Average temperature of hot and cold tubes
  • Average temperature of hot and cold flow at the end
  • f the hot leg
  • Mass flow rate through the tube bundles
  • Mass flow rate at the end of hot leg

The monitoring location for the temperature and mass flow rate of hot leg and tubes are shown in Fig. 4.

  • Fig. 4. Monitoring location for temperature and mass flow rate

The target heat transfer rate at the tube bundle increases gradually from 25 to 100 % of the experimental data. The previous analysis results with lower heat transfer rate is used as initial values for the next analysis of higher heat transfer rate. The analysis results are compared from Fig. 5 to 6. In Fig.5, the number of hot tubes are relatively high regardless of mass flow rate at hot leg. In Fig. 6, more mass flow rate at hot leg is calculated when 100 % target heat transfer rate at the tube bundle is assumed. The velocity distribution in Fig. 7 shows the instable mixing of hot and cold region at their interface of the hot

  • leg. In order to improve the accuracy of the analysis,

steam generator inlet plenum mixing condition is controlled according to the modeling method of the hot

  • leg. The following three methods for the modeling of the

hot leg shown in Table 3 are considered. The target heat transfer rate at the tube bundle is 100 % of the experimental data, not increasing from 25 to 100 %.

  • Fig. 5. Number of hot tubes according to hot leg mass flow rate
  • Fig. 6. Heat transfer rate at tube bundle according to hot leg

mass flow rate

  • Fig. 7. Velocity vector of the base case

Transactions of the Korean Nuclear Society Virtual Spring Meeting July 9-10, 2020

slide-3
SLIDE 3

Table 3. Hot leg modeling methods

The geometry of the hot leg Base case : division of inlet of hot leg only (upper inlet part (60%) and outlet at lower part (40 %)) Division of the entire hot leg (60 :40) No hot leg modeling Mesh density Base case (8e6 cells) Fine mesh at hot leg (9e6 cells) Fine mesh at hot leg and inlet plenum (1e7 cells)

* All analyses are performed in steady-state condition.

When the entire hot leg is divided by upper inlet part (60%) and outlet at lower part (40 %)), the reverse flow from the inlet plenum to the hot region of the hot leg is

  • bserved. Fig. 8 shows the temperature distribution with

hot and cold region separation of the hot leg according to turbulence model. And Fig. 9 shows temperature distribution with no hot leg modeling.

(a) Standard k-ε (b) k-ω SST (c) Reynolds stress

  • Fig. 8 Temperature distribution with hot and cold region

separation

  • Fig. 9 Temperature distribution with no hot leg modeling

In Fig. 10, it is shown that the boundary between the hot and cold region of the hot leg becomes smooth when small number of mesh is used. The main results of hot leg modeling are summarized in Table. 4. For the various turbulence models, k-ω SST and Reynolds stress models can predict well matched number of hot tubes. When there is no hot leg, the temperatures of inlet plenum, hot and cold tubes are relatively higher than the other cases. Whereas the number of hot tubes are higher than experimental data if target heat transfer rate increases gradually, the number of hot tubes decreases if 100 % target heat transfer is applied.

(a) No. of mesh: 8e6 Transactions of the Korean Nuclear Society Virtual Spring Meeting July 9-10, 2020

slide-4
SLIDE 4

(b) No. of mesh: 9e6 (c) No. of mesh: 1e7

  • Fig. 10 Temperature distribution according to mesh density

Table 4. Summary of results according to hot leg modeling

Analysis conditions Results Hot leg geometry Turbulence model No.

  • f

mesh

  • No. of

hot tubes Temperature

  • f hot tube

Mixing fraction Experiment

75 100.8 0.85

Hot and cold region separation at entire hot leg Standard k-ε 8e6 54 (-28.0) 101.2 (+0.4) 0.86 (+1.2) k-ω SST 75 (0.0) 96.7 (-4.1) 0.92 (+8.2) Reynolds stress 78 (+4.0) 99.8 (-1.0) 0.82 (-3.5) No hot leg Reynolds stress 54 (-28.0) 147.1 (+45.9) N/A Hot and cold region separation

  • nly at inlet
  • f hot leg

Reynolds stress 8e6 51 (-32.0) 100.4 (-0.4) 0.85 (0.0) 9e6 65 (+13.3) 109.4 (+8.5) 0.84 (-1.2) 1e7 66 (+12.0) 113.0 (+12.1) 0.82 (-3.5) * Items in ( ) means difference with the experimental data in %. * Items in bold are the analysis data within 5 % difference.

  • 4. Conclusions

In this study, the 1/7th scale steam generator inlet plenum mixing has been validated using CFD. Full tube bundle is modeled without simplification and heat transfer coefficient from the tube is controlled by UDF. From the analysis results, the following conclusions can be drawn:

  • When heat transfer rate from tube bundle is applied

from 25 to 100 % gradually, more hot tubes are evaluated than the experimental data. For the similar level of mass flow rate at the hot leg, the less heat transfer rate from tube bundle than the experimental data is evaluated.

  • When heat transfer rate from tube bundle is applied

100 % directly without gradual increase, the number of hot tubes, temperature of hot tubes and mixing fraction decreases and they approach to the experimental data.

  • The modeling methods of the hot leg can affect inlet

plenum flow and heat transfer characteristics of hot

  • tubes. Instable flow patterns in the hot leg increases

if mesh density increases. The flow instability of the hot leg may result in the inconsistent analysis results. Therefore, the analysis including the reactor modeling will be performed as a future work. ACKNOWLEDGEMENT This work was supported by the Nuclear Safety Research Program through the Korea Foundation of Nuclear Safety (KoFONS) using financial resources by Nuclear Safety and Security Commission (NSSC), Republic of Korea (No. 1805001). REFERENCES

[1] S. Sancaktar et al., Consequential SGTR analysis for Westinghouse and Combustion Engineering plants with thermally treated Alloy 600 and 690 steam generator tubes, NUREG-2195, 2018. [2] W. A. Stewart et al., Natural circulation experiments for PWR high-pressure accident, EPRI TR-102815, 1993. [3] C. F. Boyd et al., CFD analysis of 1/7th scale steam generator inlet plenum mixing during a PWR severe accident, NUREG-1781, 2003. Transactions of the Korean Nuclear Society Virtual Spring Meeting July 9-10, 2020