
SLIDE 1
Central Plaza Hotel Public Company Limited - CENTEL Q1/19 - - PowerPoint PPT Presentation
Central Plaza Hotel Public Company Limited - CENTEL Q1/19 Opportunity Day Presentation Agenda Q1/19 summary performance Hotel business overview Food business overview CAPEX and guidance 2019 Appendix Consolidated earning
THB million Q1/18 Q1/19 % Chg Total hotel revenue* 2,948.8 2,755.6
Total food revenue 2,792.5 2,887.4 3.4% Total revenues 5,741.3 5,643.0
EBITDA 1,664.4 1,497.6
EBITDA margin (%) 29.0% 26.5%
Net profit 883.0 825.9
Note: excluding non-recurring item Less: insurance claim (net of tax)**
na Net profit excluding non-recurring item 883.0 745.3
Note: * Total hotel revenue included deferred rental income 24.7 mn per year ** Insurance claim from fire at Central World, Big C Rajdamri and Center One in 2010
Q1/19 Summary Performance Page 3
Page 4
Gearing ratio Dec 2018 Mar 2019 Current ratio 1.1 1.1 Interest bearing debt/Equity 0.5 0.5 Dec 2018 Mar 2019
OD, Short-term loan Debentures Long-term loan Note: * Included current portion of long-term loan and debentures
*
THB 7.1bn 1.4%
60% 34% 6% 50% 34% 16%
Dec 2018 Mar 2019 Financial position
Total liabilities Total equity
52% 48% 53% 47%
THB 26.4 bn 2.7% Total interest bearing debt
Q1/19 Summary Performance
THB 27.1 bn THB 7.0bn
Hotel Business Overview Page 6
6 Source: Ministry of Tourism and Sport
10.6 8.9 9.1 9.7 10.8 15.4% 9.1% 2.7% 4.3% 1.5%
5.0 15.0 25.0 35.0 45.0 55.0
Q1/18 Q2/18 Q3/18 Q4/18 Q1/19
Growth yoy
Thailand number of tourist arrivals
Unit: million
Drop in Chinese (-2.1%) and European (-2.5%)
Page 7
(Unit : Person) Source: Ministry of Tourism and Sport
Top 10 - International Tourist Arrivals growth Q1/19 (%) Hotel Business Overview
China 3,107,978 29% Malaysia 915,922 9% Russia 615,516 6% Korea 537,044 5% Japan 474,225 4% India 4% Laos 4% USA 3% Germany 3% France 3% UK 3% Vietnam 2% Hong Kong 2% Cambodia 2% Taiwan 2% Others 21%
Top 15 - International Tourist Contribution Q1/19
8%
7% 9% 25% 2% 4%
3%
Hotel Business Overview Page 8
Number of operational beds*
41,137 41,503 42,355 43,660 45,106
9% 7% 8% 8% 10%
Q1/18 Q2/18 Q3/18 Q4/18 Q1/19
Bed growth yoy
Source: Ministry of Tourism, Republic of Maldives Note: * included hotels, resorts, guest houses and safari vessels Unit: beds
Number of tourist arrivals and occupancy rate (yoy)
420,103 306,412 353,944 403,815 482,978 75% 52% 57% 64% 75%
Q1/18 Q2/18 Q3/18 Q4/18 Q1/19
% Occupancy
Source: Ministry of Tourism, Republic of Maldives Unit: persons 17% 3% 4% 3% 15%
Page 9
(Unit : Person) Source: Ministry of Tourism Republic of Maldives
Top 10 – International tourist arrivals growth Q1/19 (%)
Hotel Business Overview
China 76,568 16% Italy 52,848 11% Germany 37,279 8% UK 36,116 7% India 36,053 7% France 6% Russia 5% U.S.A. 3% Japan 2% Switzerland 2% Australia 2% Austria 2% Korea 2% Saudi Arabia 1% Malaysia 1% Others 24%
Top 15 - International Tourist Contribution Q1/19
6% 27% 14% 11% 86% 28% 8% 44% 5%
Page 10
In operation Pipeline Thailand Overseas Total Thailand Overseas Total Grand total Owned 15* 2 17 2 3 5 22 Managed 18 4 22 10 14 24 46 Total 33 6 39 12 17 29 68 In operation Pipeline Thailand Overseas Total Thailand Overseas Total Grand total Owned 3,932 252 4,184 412 911 1,323 5,507 Managed 2,593 786 3,379 1,778 2,813 4,591 7,970 Total 6,525 1,038 7,563 2,190 3,724 5,914 13,477
As of March 2019
55% Owned
Total portfolio by rooms
*Including JV and property fund
65% Thailand 41% Owned
Number of hotels Number of rooms In operation by rooms
86% Thailand
Hotel Business Overview
11
Hotel Business Overview Page 11
# of rooms Owned Managed Total Year 2019E 2021E 2022 E 2019E 2020E 2021E 2022E Bali 210 210 Cambodia 240 240 China 300 296 596 Doha 509 509 Dubai 601 601 Laos 322 56 200 578 Maldives 310 231 541 Turkey 449 449 Thailand 282 130 329 391 538 520 2,190 Total Rooms 282 731 310 329 1,762 890 1,610 5,914 Total Hotels 1 3 1 2 8 6 8 29
As of March 2019
Summary of pipeline 2019E-2022E
China 596 keys East Asia Turkey 449 keys West Asia Bali, Cambodia, Laos and Thailand 3,218 keys Southeast Asia Maldives 541 keys South Asia Doha and Dubai 1,110 keys Middle East
Total portfolio: number of rooms by region
*
* Target to open in September 2019
2,949 2,756 1,324 1,176
500 1,000 1,500 2,000 2,500 3,000 3,500Q1/18 Q1/19
Total Revenue EBITDA before extra items
6.5% 11.2%
12
Hotel Business Overview Page 12
42.7%
Unit: THB mn
EBITDA margin 44.9%
13
Hotel Business Overview Page 13
5,690 5,541 4,894 4,615 86.0% 83.3%
50% 55% 60% 65% 70% 75% 80% 85% 90%
1,000 2,000 3,000 4,000 5,000 6,000 7,000 8,000 9,000 10,000Q1/18 Q1/19
Average Room Rate (ARR) Revenue Per Available Room (RevPar) Occupancy (OCC)
5.7% 2.7% 2.6%
14
Hotel Business Overview Page 14 4,671 4,530 4,017 3,750 86.0% 82.8%
50% 55% 60% 65% 70% 75% 80% 85% 90%
1,000 2,000 3,000 4,000 5,000 6,000 7,000 8,000 9,000Q1/18 Q1/19
Average Room Rate (ARR) Revenue Per Available Room (RevPar) Occupancy (OCC)
6.7% 3.2% 3.0%
15
Hotel Business Overview Page 15
3,244 3,299 2,798 2,657 86.3% 80.5%
50% 55% 60% 65% 70% 75% 80% 85% 90%
1,000 2,000 3,000 4,000 5,000 6,000 7,000 8,000Q1/18 Q1/19
Average Room Rate (ARR) Revenue Per Available Room (RevPar) Occupancy (OCC)
5.0% 5.8% 1.7%
16
Hotel Business Overview Page 16
5,366 5,111 4,608 4,288 85.9% 83.9%
50% 55% 60% 65% 70% 75% 80% 85% 90%
1,000 2,000 3,000 4,000 5,000 6,000 7,000 8,000 9,000 10,000Q1/18 Q1/19
Average Room Rate (ARR) Revenue Per Available Room (RevPar) Occupancy (OCC)
4.8% 2.0% 6.9%
17
Hotel Business Overview Page 17
21,492 19,746 18,524 17,956 587 568 86.2% 90.9%
10% 20% 30% 40% 50% 60% 70% 80% 90%
5,000 10,000 15,000 20,000 25,000 30,000Q1/18 Q1/19
Average Room Rate (ARR) Revenue Per Available Room (RevPar) RevPar (USD) Occupancy (OCC)
8.1% 3.1% 4.7% 3.2%
Page 18
29.9% 17.1% 17.5% 12.1% 7.7% 6.7% 7.0% 2.0% 29.8% 17.8% 17.9% 12.0% 8.3% 5.6% 6.7% 1.9% Bangkok Maldives Phuket Pattaya Hua Hin Samui Krabi Others
Total revenue
Q1/19 Bangkok Maldives Phuket Pattaya Hua Hin Samui Krabi Hat Yai Tak % RevPar Growth yoy
0.7%
Hotel Business Overview
done
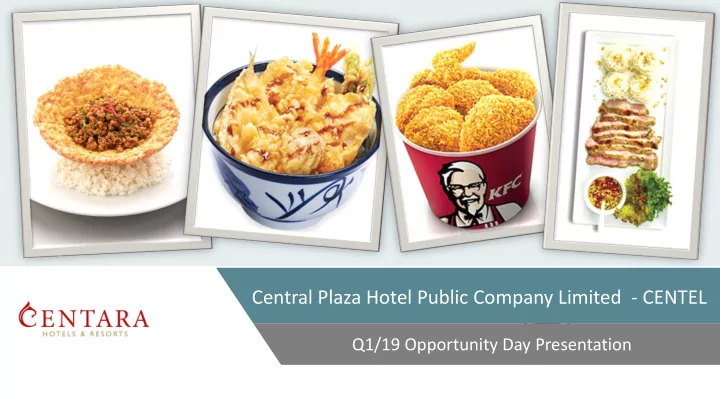
Page 20 Food Business Overview Bangkok Upcountry
65% Upcountry 64% Upcountry
Brands # of outlets % Change yoy
KFC 269 9.3% Mister Donut 365 8.3% Auntie Anne’s 172 16.2% Ootoya 46 4.5% Pepper Lunch 42 27.3% The Terrace 9
19 5.6% Yoshinoya 22 37.5% Tenya 10 42.9% Katsuya 28 33.3% Cold Stone 18
Aroi Dee 3 na Total 1,003 11.6% Number of outlets by location Revenue contribution by location
Page 21 Food Business Overview
32% 32%
Unit: THB mn
2,793 2,887 341 322
500 1,000 1,500 2,000 2,500 3,000 3,500Q1/18 Q1/19
Total Revenue EBITDA
5.4% 3.4% EBITDA Margin
11.2% 12.2%
Page 22 Food Business Overview Same store sale (SSS) and Total system sale (TSS) Same store sale (SSS): Bangkok vs Upcountry
1.4%
3.3%
0.5% 2.1%
Bangkok Upcountry
0.0% 2.6%
7.9% 10.0% 12.5% 6.5% 3.4%
SSS TSS
1Q18 1Q18 2Q18 2Q18 3Q18 3Q18 4Q18 4Q18 1Q19 1Q19
Page 23
KFC, 57% Mister Donut, 14% OOTOYA, 8% Auntie Anne's, 7% Others, 14%
12%
Food Business Overview
(+7.5% yoy) (+2.9% yoy) (+1.1% yoy) (+6.1% yoy) (-13.8% yoy)
Page 24
Suki House Details Category Suki homemade style Opened April 3, 2019 Location Gate Way @ Bang Sue Market target Scalable Number of outlets in 2019 4 Target payback period 3 years
Page 26
4,000 6,000 8,000 10,000
2018A 2019E 2020E 2021E
Hotel Food Potential projects
Financial Highlight 2020E 2019E 2021E
Centara Grand Central World
Renovation & Enhancement New Investment & Expansion
Centara Grand Samui Centara Grand Hua Hin* New investment in food brand(s) & hotel(s)* Food outlet expansion 2 new Centara Maldives Centara Dubai COSI Pattaya COSI Chiang Mai
Annual renovation for existing hotels Annual renovation for existing CRG’s outlets
Note: *potential projects are under feasibility study
…
Page 27 Financial Highlight
Hotel 2018A* 2019E - Revised Occupancy 82.6% 83% - 85% RevPar
Flat Food 2018A 2019E - Revised SSS 0.1% Flat TSS 9.3% 5% - 6% Outlet Expansion 7.5% 8% - 9% Hotel: 2019
to major renovation of Centara Grand Samui from June 2019 onwards Food: 2019
light food brand)
*Excluded COSI Samui and Centra Chaengwatthana
28
Page 28 Q&A
This presentation contains certain forward looking statements. Such forward looking statements are not guarantees of future performance and involve risks and uncertainties, and actual results may differ from those in the forward looking statements as a result of various factors and circumstances. The views, analyses and opinions expressed herein contain some information derived from publicly available sources and third party information providers. No representation or warranty is made as to the accuracy, completeness, or reliability of such information. This presentation should not be relied upon as any recommendation, view, opinion, representation or forecast of “Central Plaza Hotel Plc.” Nothing in this presentation should be construed as either an offer to sell, a solicitation of an offer to buy or sell shares or any type of securities in any
must always seek the relevant professional advice before otherwise making any such financial, legal or commercial decisions.
29
Page 29
Page 31 Appendix
0.1 9.7 13.7 34.5 5 10 15 20 25 30 35 40
Centara Grand Hua Hin Centara Grand Ladprao Centara Grand Central World COSI Samui
Remaining Years
CHBR 7% CGLB 10% CGCW 20%
37% 0% 0% 46% 17%
Thailand freehold Thailand leasehold Maldives leasehold
Page 32 Appendix
Owned hotels Stars Opened # of Rooms % Ownership Location 1 Centara Grand at Central Plaza Ladprao Bangkok 5 2Q83 565 100% Thailand 2 Centara Grand Resort & Villas Hua Hin 5 1Q86 249 64% Thailand 3 Centra by Centara Hotel Mae Sot* 3 4Q89 120 100% Thailand 4 Centara Hat Yai 4 4Q95 248 100% Thailand 5 Centara Grand Beach Resort Samui 5 2Q96 203 25% in Property Fund Thailand 6 Centara Villas Samui 4 2Q00 102 100% Thailand 7 Centara Villas Phuket 4 2Q00 72 100% Thailand 8 Centara Grand Beach Resort & Villas Krabi 5 4Q05 192 100% Thailand 9 Centara Kata Resort Phuket 4 2Q06 163 100% Thailand 10 Centara Karon Resort Phuket 4 2Q06 335 100% Thailand 11 Centara Grand at CentralWorld 5 4Q08 512 100% Thailand 12 Centara Grand Mirage Beach Resort Pattaya 5 4Q09 555 100% Thailand 13 Centara Grand Island Resort & Spa Maldives 5 4Q09 112 74% Maldives 14 Centara Grand Beach Resort Phuket 5 4Q10 262 100% Thailand 15 Centara Ras Fushi Resort & Spa Maldives 4 1Q13 140 75% Maldives 16 COSI Samui Chaweng Beach Affordable lifestyle 4Q17 150 100% Thailand 17 Centra by Centara Government Complex Hotel & Convention Centre Cheang Watthana 3 4Q12 204 100% Thailand Total owned hotels 4,184
*Rebranded from” Centara” to “Centra” effective since October 20, 2018
Page 33 Appendix
Managed hotels Stars Opened # of Rooms Country 18 Centara Chaan Talay Resort & Villas Trat 4 1Q08 44 Thailand 19 Centara Hotel & Convention Centre Udon Thani 4 2Q10 259 Thailand 20 Centara Q Resort Rayong 4 2Q10 41 Thailand 21 Khum Phaya Resort, Centara Boutique Collection Boutique 3Q10 87 Thailand 22 Waterfront Suites Phuket by Centara Residence 1Q11 39 Thailand 23 Centara Anda Dhevi Resort & Spa Krabi 4 4Q11 135 Thailand 24 Centara Pattaya Hotel 4 4Q11 152 Thailand 25 Centara Nova Hotel & Spa Pattaya 4 4Q11 79 Thailand 26 Centara Koh Chang Tropicana Resort 4 2Q12 157 Thailand 27 Centra Coconut Beach Resort Samui 3 3Q12 55 Thailand 28 Sandy Beach Non Nuoc Resort Danang Vietnam Managed by Centara 4 4Q12 204 Vietnam 29 Centara Watergate Hotel & Spa Bangkok 4 2Q13 281 Thailand 30 Centara Seaview Resort Khao Lak 4 2Q13 250 Thailand 31 Centara Grand Phratamnak Pattaya 5 3Q13 161 Thailand
Page 34 Appendix
Managed hotels Stars Opened # of Rooms Country 32 Centara Blue Marine Resort & Spa Phuket 4 1Q14 266 Thailand 33 Centara Ceysands Resort & Spa Srilanka 4 2Q14 165 Sri Lanka 34 Centra by Centara Avenue Hotel Pattaya 3 4Q14 51 Thailand 35 Centra by Centara Maris Resort Jomtien 3 1Q16 282 Thailand 36 Centra by Centara Phu Pano Resort Krabi 3 4Q16 158 Thailand 37 Centara Azure Hotel Pattaya 4 4Q16 96 Thailand 38 Centara Muscat Hotel 4 2Q17 152 Oman 39 Centara West Bay Residences & Suites Doha Residence 4Q18 265 Qatar Total managed hotels 3,379 Grand total 7,563