cee 370 environmental engineering principles
play

CEE 370 Environmental Engineering Principles Lecture #32 - PDF document

CEE 370 Lecture #32 11/26/2019 Print version Updated: 26 November 2019 CEE 370 Environmental Engineering Principles Lecture #32 Wastewater Treatment III: Process Modeling & Residuals Reading M&Z: Chapter 9 Reading: Davis &


  1. CEE 370 Lecture #32 11/26/2019 Print version Updated: 26 November 2019 CEE 370 Environmental Engineering Principles Lecture #32 Wastewater Treatment III: Process Modeling & Residuals Reading M&Z: Chapter 9 Reading: Davis & Cornwall, Chapt 6-1 to 6-8 Reading: Davis & Masten, Chapter 11-11 to 11-12 David Reckhow CEE 370 L#32 1 
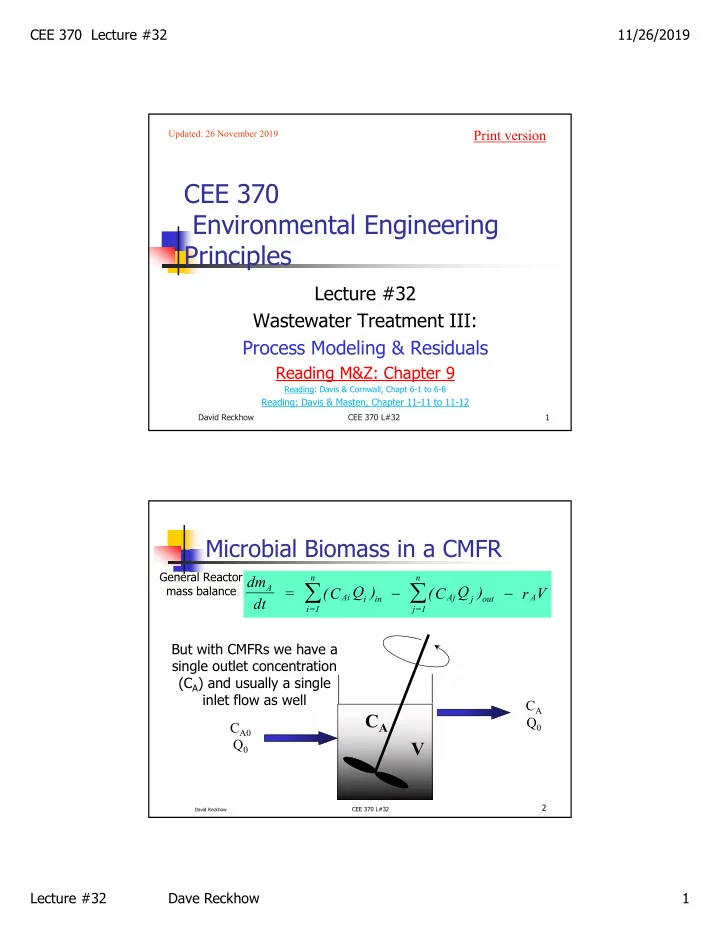
Microbial Biomass in a CMFR General Reactor n n dm   A (C Q )  (C Q )  mass balance dt = r V Ai Aj A i in j out i=1 j=1 But with CMFRs we have a single outlet concentration (C A ) and usually a single inlet flow as well C A C A Q 0 C A0 Q 0 V 2 CEE 370 L#32 David Reckhow Lecture #32 Dave Reckhow 1

  2. CEE 370 Lecture #32 11/26/2019 Batch Microbial Growth 0 0 General Reactor n n dM   A  (C Q ) (C Q ) mass balance = - r V Ai Aj A i in j out dt i=1 j=1 Batch reactors are usually filled, allowed to react, then emptied for the next batch Because there isn’t any flow in a batch reactor: 1 C A dM A = - r A V dt For 1 st order V X kX And: biomass growth dC A dt = - r A 3 CEE 370 L#32 David Reckhow Batch Microbial Growth  Observed behavior Stationary Death Covered in lecture #17 Lag Exponential Growth Time 4 CEE 370 L#32 David Reckhow Lecture #32 Dave Reckhow 2

  3. CEE 370 Lecture #32 11/26/2019 Exponential Growth model Covered in lecture #17  dX      X  dt  gr D&M Text where, N X = concentration of microorganisms at time t t t = time  = proportionality constant or specific r growth rate, [time ─ 1 ] dN/dt dX/dt = microbial growth rate, [mass per volume-time] 5 CEE 370 L#32 David Reckhow Exp. Growth (cont.) Covered in lecture #17  dX   dX      X     dt or  dt   X  gr gr   X    ln = t   X o  t X = X e o 6 CEE 370 L#32 David Reckhow Lecture #32 Dave Reckhow 3

  4. CEE 370 Lecture #32 11/26/2019 Substrate-limited Growth  Also known as resource-limited growth  THE MONOD MODEL S   dX SX        and   X max S  max K S   dt  K S gr S where,  max = maximum specific growth rate, [day -1 ] S = concentration of limiting substrate, [mg/L] K s = Monod or half-velocity constant, or half saturation coefficient, [mg/L] 7 CEE 370 L#32 David Reckhow Monod Kinetics Covered in lecture #17 0.5*µ m K S 8 CEE 370 L#32 David Reckhow Lecture #32 Dave Reckhow 4

  5. CEE 370 Lecture #32 11/26/2019 Substrate Utilization & Yield  Related to growth by Y, the yield coefficient  Mass of cells produced H&H, Fig 11-38, pp.406 per mass of substrate utilized dX  X dt   Y  dS S dt  Just pertains to cell growth  dX  dS    Y dt dt   gr 9 CEE 370 L#32 David Reckhow Microbial Growth  dX  dS    Y  dt  dt gr  Monod kinetics in a chemostat (batch reactor) Substitute for dS   dX  SX dS XS      max   X max  S   dt  K S dt Y K S gr S & Divide by Y XS  Where  r k e su  K S  dS/dt = r su = actual substrate utilization rate S e  k = maximum substrate utilization rate = μ max /Y  S = concentration of substrate (S e in H&H)  K S = half-saturation constant  Y = cell yield = dX/dS 10 CEE 370 L#32 David Reckhow Lecture #32 Dave Reckhow 5

  6. CEE 370 Lecture #32 11/26/2019 Death  Bacterial cells also die at a characteristic first order rate with a rate constant, k  dX      k X d  dt  d  This occurs at all times, and is independent of the substrate concentration 11 CEE 370 L#32 David Reckhow Overall model: chemostat  Combining growth and death, we have:  dX   dX   dX           dt   dt   dt  net gr d SX    k X See: M&Z equ 9.3 max d  K S S  And in terms of substrate utilization  dX  dS   Y    dt  dt gr  dX   dS      Y   k X d dt dt     net 12 CEE 370 L#32 David Reckhow Lecture #32 Dave Reckhow 6

  7. CEE 370 Lecture #32 11/26/2019 Activated Sludge Flow Schematic  Conventional X o Q+ Q r Q X X e Effluent S o Aeration S S Basin Settling Influent Tank V,X Q r X r Return activated sludge Q w X r S 13 Waste activated sludge CEE 370 L#32 David Reckhow Efficiency & HRT  Efficiency of BOD removal    S S 100 %  E o S o  Hydraulic Retention Time, HRT (Aeration Time)  Same as retention time in DWT (t R ) V    Actual HRT is a bit different Q  Isn’t used as much in design V   act  Q Q R 14 CEE 370 L#32 David Reckhow Lecture #32 Dave Reckhow 7

  8. CEE 370 Lecture #32 11/26/2019 SRT – solids retention time & R  SRT: Primary operation and design parameter  How long does biomass stay in system XV XV      See: M&Z equ 9.10 c   Q Q X Q X Q X w e w r w r  Typically equals 5-15 days Q  Recycle Ratio  R r Q  Values of 0.25-1.0 are typical 15 CEE 370 L#32 David Reckhow F:M Ratio and volumetric loading  Food-to-Microorganism Ratio (F/M)  F Q BOD   M V X F QS  o M&Z equ 9.16 M XV  Typical values are 0.2-0.6 in complete mixed AS  BOD volumetric Loading QS  Loading o V  Typically 50-120 lb BOD/day/1000ft 3 tank volume 16 CEE 370 L#32 David Reckhow Lecture #32 Dave Reckhow 8

  9. CEE 370 Lecture #32 11/26/2019 Act. Sludge: Biomass Model  dX   dX   dX     Steady State mass balance on biomass        dt   dt   dt  net gr d   dX dX SX  0     V QX Q X Q X V      k X max  d o e e w r K S dt  dt  S batch From chemostat model  Incorporating the chemostat model gets:   dX SX          V 0 QX Q X Q X V k X   o e e w r max d  dt K S   S  And simplifying   SX         QX Q X Q X V k X   o e e w r max  d K S   S  Finally, we recognize that the amount of solids entering with the WW (i.e., X o ) and leaving in the treated effluent (i.e., X e ) is quite small and can be neglected 17 CEE 370 L#32 David Reckhow Biomass Model II  So it becomes   SX      Q X V k X   w r max  d K S   S  And rearranging Q X S 1     w r k  max d  VX K S c S Earlier equation for SRT XV XV      c   Q Q X Q X Q X w e w r w r 18 CEE 370 L#32 David Reckhow Lecture #32 Dave Reckhow 9

  10. CEE 370 Lecture #32 11/26/2019 Act. Sludge: Substrate Model  Steady state mass balance on substrate  dS XS  max S  dt Y K S dS  dS   0     V QS Q S Q S V   o e w From chemostat model dt  dt  batch  Substituting and noting that Q e =Q-Q w    XS       max QS QS Q S Q S V   o w w  Y K S   S  And further simplifying    XS       Q S S V max   o  Y K S   S 19 CEE 370 L#32 David Reckhow Merging the biomass & substrate models If we divide the previous equation by V and X         Q S S S XS        Q S S V max o max   o  Y K S    VX Y K S S S Multiply both sides by Y     YQ S S S   o M&Z equ 9.8 max  VX K S S Now insert the LH term into the 1  Q X S     w r k earlier equation based on biomass  max  d VX K S c S    1 Q X YQ S S    w r o k M&Z equ 9.9  d VX VX c 20 CEE 370 L#32 David Reckhow Lecture #32 Dave Reckhow 10

  11. CEE 370 Lecture #32 11/26/2019 Combined model II  Now recognize that Q/V is the reciprocal of the HRT    1 1 Y S S    o k d  X c 21 CEE 370 L#32 David Reckhow Question  All else being equal, as SRT goes up: Settleability goes down 1. F/M goes down 2. Waste sludge return ratio must go down 3. Endogenous respiration becomes less 4. important Sludge yield increases 5. 22 CEE 370 L#32 David Reckhow Lecture #32 Dave Reckhow 11

Download Presentation
Download Policy: The content available on the website is offered to you 'AS IS' for your personal information and use only. It cannot be commercialized, licensed, or distributed on other websites without prior consent from the author. To download a presentation, simply click this link. If you encounter any difficulties during the download process, it's possible that the publisher has removed the file from their server.

Recommend


More recommend