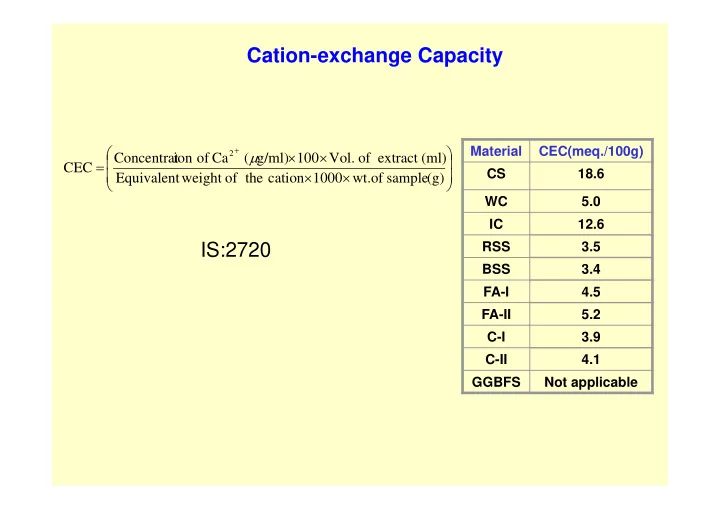
SLIDE 1 Material CEC(meq./100g) CS 18.6 WC 5.0 IC 12.6 RSS 3.5 BSS 3.4 FA-I 4.5 FA-II 5.2 C-I 3.9 C-II 4.1 GGBFS Not applicable
Cation-exchange Capacity
(g) sample
wt. 1000 cation the
weight Equivalent (ml) extract
Vol. 100 g/ml) ( Ca
ion Concentrat CEC
2
IS:2720
SLIDE 2
Scanning Electron Microscopy (SEM)
For obtaining very detailed images at much higher magnifications ~100,000x than is possible with a light microscope. The SEM images the surface structure of bulk specimens (biological, medical, materials sciences and earth sciences) Image is created by using electrons instead of light waves. Images have a greater depth of field and resolution than optical Micrographs. Ideal for fracture surfaces & particulate materials. Energy Dispersive Spectrometer (EDS) allows elemental analysis (Sodium to Uranium, excluding Lanthanides, Actinides & gases down to levels of ~0.1 wt %) with the SEM. X-ray mapping is also possible, which shows the distribution of elements in the material. X-ray line-scans show the concentration variation of elements along a line in the material.
SLIDE 3 SEM- Working principle
- A beam of highly energetic electrons is focused on the sample
- Interaction of electrons is transformed into a 3-D image to obtain
topographical, morphological, compositional & crystallographic information.
SLIDE 4 Compacted sample Cubic specimen
Determination of fabric structure of fine-grained soils Using SEM
Specimen preparation (Challenges):
- Removal of pore fluid from the specimen without disturbing its microstructure.
- Freeze-drying technique (for swelling/shrinking type of soils)
- Air-drying technique (for non swelling/shrinking type of soils)
- Specimen should be able to withstand the vacuum inside the microscope.
- As illumination is with electrons, specimen should be made to conduct electricity.
- Specimen are coated with a very thin layer of Gold or Carbon (a sputter coater).
- Gold coating film can absorb X-ray signal generated into the specimen.
- For obtaining X-ray spectrum of a non-conducting sample a coating material very
transparent to the X-ray (Carbon) must be utilized.
SLIDE 5
Kaolinite plate stacks Face-Face interaction
SLIDE 6
Face-Edge & Edge-Edge interactions
SLIDE 7
- Geomaterials are composed of wide range of particle sizes and
shapes and are porous in nature.
- A knowledge of pore structure of these materials is important as it can
give insight in to both the microstructure and the performance.
- Rather than measuring the porosity, It becomes more informative if the
manner in which volume is distributed With respect to pore size.
Mercury Intrusion Porosimetry (MIP) Dead end Closed Inter-connected Passing
SLIDE 8
Non-porous solids (Extremely low surface area) Porous solids medium high surface area, pore volume and dimension Particulates particle size and surface area Catalysts: activated sites on porous support or powder
Porosity
SLIDE 9
Conical Slits Cylindrical Spherical or Ink Bottle Interstices
Shape of Pores
SLIDE 10
Micropores: 0 < d < 2 nm (zeolites, carbons, silica fumes) Mesopores: 2 < d < 50 nm (alumina, polymers, catalysts) Macropores: 50 < d < ...nm (rocks, cements, soils, ...)
Bulk, apparent and real density [g/ cc] Percentage porosity [% ] Pore volume/ pore size distribution [pore volume vs pore size] Total pore volume [cc/ g] Average pore size S pecific surface area [m2/ g] Particle size distribution [relative percentage vs particle size]
Pore size classification and parameters
SLIDE 11
Pore size distribution
Particle size distribution
Bulk density
Apparent density
Total porosity
Pore area distribution
Low/high specific surface
Micro/mesopores distribution
Micro/mesopores total volume
Real density
Mercury porosimetry Gas adsorption Helium Pycnometry
Characterization schemes
SLIDE 12 Mercury Intrusion Porosimetry (MIP)
- Mercury intrusion Porosimetry is regarded as a standard
measure for macro and meso pore size distributions.
- Since this technique is Conceptually much simpler.
- Experimentally much faster .
- Unique in its ability to evaluate a much wider range of
pore sizes than the alternative methods (gas sorption , calorimetry, scanning electron microscopy, thermoporometry).
- The technique of mercury Porosimetry is used not only
to determine the distribution of pores in various soils but also how it changes for various loading conditions
SLIDE 13 Mercury Porosimetry concept
- Hg is a non-wetting liquid for many
solids
- Hg must be forced to penetrate pores
- Penetration pressure is related to pore
size
- Volume of Hg is related to pore
volume
wetting
non wetting
SLIDE 14 Working principle: P = 2.(T.cosθ)/r ……Washburns Equation
Volume of mercury Pressure
Intrusion curve Extrusion curve
A
Information obtained
- the pore size distribution
- surface area
- equivalent pore size
- critical pore diameter
- distribution of total porosity
- free porosity and trapped porosity
Typical MIP characteristic curve
A: hysterisis
SLIDE 15
SLIDE 16
Two systems presenting similar mercury intrusion test results