
SLIDE 1
Solar Physics & Space Plasma Research Centre
University of Sheffield
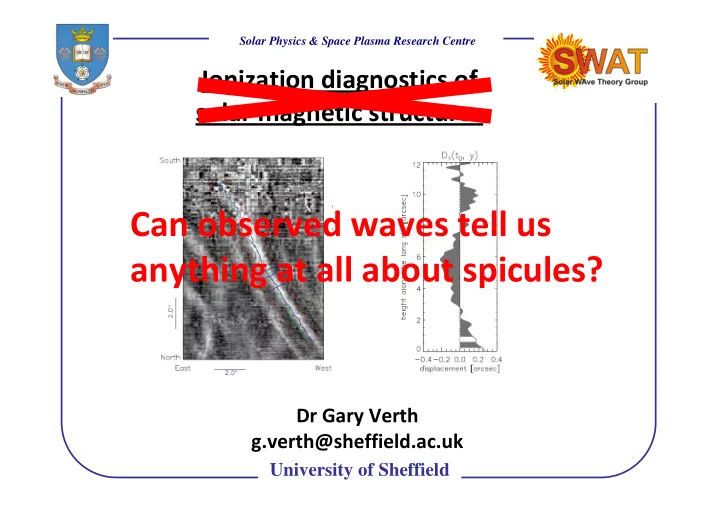
Can observed waves tell us anything at all about spicules? Dr Gary - - PowerPoint PPT Presentation
Solar Physics & Space Plasma Research Centre Ionization diagnostics of solar magnetic structures Can observed waves tell us anything at all about spicules? Dr Gary Verth g.verth@sheffield.ac.uk University of Sheffield Solar Physics &
Solar Physics & Space Plasma Research Centre
University of Sheffield
Solar Physics & Space Plasma Research Centre
University of Sheffield
Jesse Andries
Solar Physics & Space Plasma Research Centre
University of Sheffield
Traditionally using spectral line intensities. Assuming filling factor, background subtraction, etc. correct still forced to make many assumptions. Intensity Source function Opacity Plasma density Geometric depth
Solar Physics & Space Plasma Research Centre
University of Sheffield
Spicules very narrow features at spatial resolution limit of telescopes, e.g., SOT (approx. 200 km). Unresolved expanding flux tube De Forest (2007)
Solar Physics & Space Plasma Research Centre
University of Sheffield
Density model from eclipse flash spectra (Makita 2003). Assumptions 1) constant source function 2) intensity of metallic lines ∝ intensity of hydrogen density (Zirker 1958) 3) Balmer line intensity ∝ ne np (isothermal plasma assumption) 4) Height dependent spicule filling factor 0.01-1.01
Solar Physics & Space Plasma Research Centre
University of Sheffield
From Centeno et al. (2010). S/N ratio poor for off-limb Zeeman and Hanle
and 3” above limb). Much longer than lifetime of individual spicules.
Solar Physics & Space Plasma Research Centre
University of Sheffield
Example of propagating kink wave observed in spicule with Hinode/SOT Ca II H filter from He et al. (2009). Relatively undynamic “Type I” spicule.
Flow speed (up and down) ≈ 10 km s-1 Phase speed ≈100 km s-1 → Sub-Alfvenic flow (not always the case!)
Solar Physics & Space Plasma Research Centre
University of Sheffield
Time (0 - 360s) Height (0 - 7 Mm) Can measure the follow crucial wave parameters as a function of height (He et al. 2009) 1) Period 2) Phase travel time (→phase speed) 3) Velocity amplitude Wave propagates along the spicule in about 150 s, well within the spicule lifetime.
Solar Physics & Space Plasma Research Centre
University of Sheffield
From He et al. (2009). See also earlier work by Zaqarashvili et al. (2007)
Using ideal MHD Allow internal and external plasma density to be different Assume average R dependence for magnetic field, i.e,
Solar Physics & Space Plasma Research Centre
University of Sheffield
Solar Physics & Space Plasma Research Centre
University of Sheffield
m=0 (the “torsional Alfven wave”) m=1 (the “kink wave”) See e.g. Hollweg (1981), Poedts et al. (1985). Verth & Erdélyi (2008), Ruderman et
N.B. not the same as equation by Spruit (1981)!
Solar Physics & Space Plasma Research Centre
University of Sheffield
WKB solution for velocity amplitude is 1) 2) 3)
Solar Physics & Space Plasma Research Centre
University of Sheffield
In study by He et al. (2009) they use Hinode/SOT to measure amplitudes and wavelengths in spicules. Are there understandable trends here?
Solar Physics & Space Plasma Research Centre
University of Sheffield
Following on from Roberto’s talk. Ion-neutral damping is a frequency dependent effect. To compete with damping due to resonant absorption need Martinez-Sykora et al. (2012) Okamoto & De Pontieu (2011).
Solar Physics & Space Plasma Research Centre
University of Sheffield
In the TTTB approximation damping length due to RA was investigated by Terradas et al. (2010), Verth et al. (2010) and Soler et al. (2011) Equilibrium type Damping relation
Solar Physics & Space Plasma Research Centre
University of Sheffield
Assume a straight tube (constant magnetic field ), constant density
Solar Physics & Space Plasma Research Centre
University of Sheffield
Assume a expanding tube (non-constant magnetic field) and non-constant density so that kink speed varies.
Solar Physics & Space Plasma Research Centre
University of Sheffield
The trend in non-thermal spectral line broadening (interpreted as velocity amplitude) has been claimed to be the source for both coronal heating and solar wind acceleration (Hahn et al. 2012, Bemporad & Abbo 2012) McIntosh et al. (2011) used SDO/AIA to estimate phase speed with height. Measured average velocity amplitude of 25 km s-1
It is well known (Kneser`s oscillation theorem) that the governing kink wave equation can have a cutoff if is increasing linearly with height (or greater).
Solar Physics & Space Plasma Research Centre
University of Sheffield
Linear profile Quadratic profile
Solar Physics & Space Plasma Research Centre
University of Sheffield
Okamoto & De Pontieu (2011) studied wave properties of large sample. 59% propagating up 21% propagating down 20% standing 1) High pass filtering due to longitudinal stratification (cutoff frequency) 2) Low pass filtering caused by transverse stratification (resonant absorption or ion- neutral damping)
Solar Physics & Space Plasma Research Centre
University of Sheffield
From observational case study of He at al. (2009) , all wave variables, apart from R(s), can be estimated. where
Solar Physics & Space Plasma Research Centre
University of Sheffield
Solar Physics & Space Plasma Research Centre
University of Sheffield
Solar Physics & Space Plasma Research Centre
University of Sheffield
Tsuneta et al. (2008) estimated upper limit area expansion of 345 between photosphere and corona (in Sun’s south polar region). Tu et al. (2005)
Solar Physics & Space Plasma Research Centre
University of Sheffield
Comparison with average unsigned magnetic field from 3D radiative MHD simulations of De Pontieu et al. (2007) (courtesy M. Carlsson).
Solar Physics & Space Plasma Research Centre
University of Sheffield
Comparison between wave study result and 3D radiative MHD simulation highly dubious! A dipole structure at footpoint of spicule, c.f., simulation?
Solar Physics & Space Plasma Research Centre
University of Sheffield
Electron density Spectroscopic studies of Becker (1968), Makita (2003) Plasma density Spectroscopic study of Makita (2003) Estimate using kink wave observation by Verth et al. (2011) TEMPERATURE INCREASE WITH HEIGHT (De Pontieu et
Solar Physics & Space Plasma Research Centre
University of Sheffield
Assuming plasma density is proportional to hydrogen number density and most free electrons are from hydrogen then ionisation fraction is Makita (2003) estimate plotted for comparison.
By combining wave observation (plasma density scale gradient) and spectroscopy (electron density gradient) can estimate ionisation fraction.
Solar Physics & Space Plasma Research Centre
University of Sheffield
without value in the chromosphere!
speed and velocity amplitude. One without the other not very useful. Although can say something about cutoff frequency with just phase speed.
Certainly can help with estimating height dependence of mass density in chromosphere. Not without value!
High frequency effect. Would be difficult to disentangle from other damping effects, e.g. resonant absorption (also frequency dependent).