Building Connections: Integrating Social Determinants Frank - - PowerPoint PPT Presentation

building connections integrating social determinants
SMART_READER_LITE
LIVE PREVIEW

Building Connections: Integrating Social Determinants Frank - - PowerPoint PPT Presentation

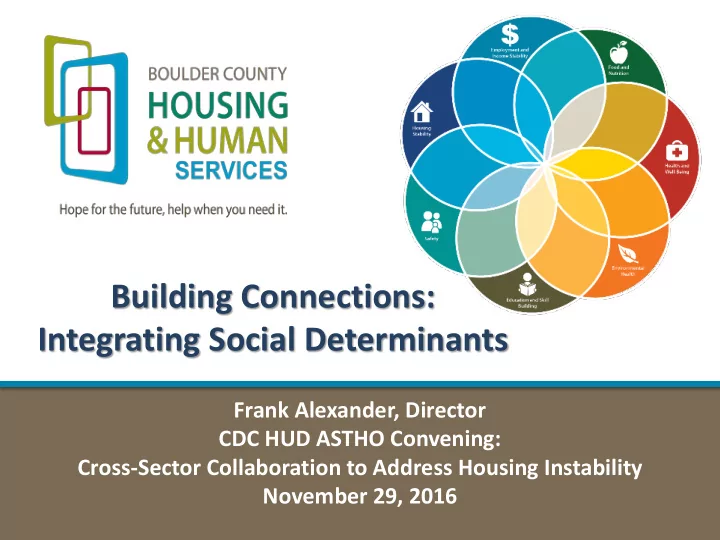
Building Connections: Integrating Social Determinants Frank Alexander, Director CDC HUD ASTHO Convening: Cross-Sector Collaboration to Address Housing Instability November 29, 2016 1 BCDHHS Agenda History behind housing and human system


slide-1
SLIDE 1

1

Frank Alexander, Director CDC HUD ASTHO Convening: Cross-Sector Collaboration to Address Housing Instability November 29, 2016

Building Connections: Integrating Social Determinants

slide-2
SLIDE 2

Hope for the future, help when you need it.

BCDHHS Agenda

 History behind housing and human system merger  Discuss partnership opportunities to accelerate system integration, targeting of prevention services, and outcome improvement  Share our organizational strategies to improve the health and well-being of our communities through SDH system integration and shift to prevention

slide-3
SLIDE 3

Building a Prevention System

New Child Welfare Cases 416

Medical Program Clients 60,154 Food Assistance Clients 29,486

ACA Enrolled Clients 22,866

Cash Assistance Clients 4,382

LEAP Families 3,039

Community Agency Families 10,487

Abuse/N eglect Hotline Calls 9,797

Section 8 & Voucher Clients 1,879 CCAP Eligible Children 1,830 Affordable Housing Clients 1,522 Community Food Share Families 2677 Weatherization Families 413 Total Child Involvements 633 HHS Case Management Families 1,302 FAR Eligible Referrals 1096

Population: 310,000 Clients: 86,000 Monthly contacts: 11,000 Poverty Rate: 14.6% Under 185% FPL: 26%

slide-4
SLIDE 4

Hope for the future, help when you need it.

Great Recession and Two Disasters

September 2013 September 2010

Over 10,500 homes damaged/destroyed $2 billion in damage to infrastructure, homes and property (FEMA) $217 million in damage to homes and property 169 homes destroyed

slide-5
SLIDE 5

System Capacity Challenges & Opportunities

How do we:

  • Reach more people

preventatively

  • Better match services to

need

  • Receive right services at

the right time

  • Improve client experience
  • Improve outcomes
  • Expand knowledge and

expertise of workforce

slide-6
SLIDE 6

Underscores the relationship between social factors and health

  • utcomes in

communities. Pushes for service frameworks and structures to align and function together to on behalf of families and individuals.

Social Determinants of Health Model

slide-7
SLIDE 7

We’re Calling This Framework ISDMC

Identify Assess Respond Manage Measure Entry – through Any Door Coordinated Community Service Delivery Common Systems Sustainable Outcomes

HHS Data Warehouse

Technology and Fiscal Integration: Data & Analytics  Strong Feedback Loop, Continuous Improvement

Integrated Service Model

slide-8
SLIDE 8

County Municipalities/Law Enforcement

  • City of Boulder, Longmont, Louisville, Lafayette, Nederland, Lyons

Local School Districts

  • Boulder Valley School District, Saint Vrain Valley School District

Community Non-Profits

  • Emergency Centers, Food Banks, Housing Providers, Family Resource Centers,

Shelters, Service Providers, Senior Services

Health Partners

  • Mental Health Partners (CMHC), Foothills Behavioral Health (BHO), Clinica Family

Health and Salud (FQHCs), IMAGINE (CCB), Hospitals

Regional Partners

  • Metro Counties, Housing Continuum of Care, State of Colorado Agencies-Energy

Office, DOLA, CDHS, CDPHE, HCPF, Housing NOW, CHSDA, CALPHO, CBHC

National Partners

  • Federal Agencies, Casey Family Programs, Corporation for Supportive Housing,

Annie E. Casey, APHSA, LIHTC Investors and Technology and Consulting firms

Community Partnerships

slide-9
SLIDE 9

Referrals Screen Outs Early Intervention FAR

High Risk Assessment Open Case

2016 YTD Through September 3,600 Referrals 2,289 Screen Outs 849 FAR Cases 395 Cases 459 HRA Cases 312 New Child Cases

Prevention Opportunities

OOH 147 New Placements

slide-10
SLIDE 10

CoC-RRH

(Federal)

HSSN

(Local)

ESG

(Fed/State)

TBRA

(State)

Community Housing Resource Panel Housing Stabilization Program FUP

(Federal)

Short- Term Housing

(CBO’s, HA)

Wrap-Around Supportive Housing Case Management

Housing Assistance: Diverse Funding

slide-11
SLIDE 11

382 765 827 2,221 1,433 846 793 2,168 2,192 2,713 2,330 2,269 853 1,673 2,251 2,344 943 896 500 1000 1500 2000 2500 3000 3500 Childcare Employment Food Health Access Housing Income Physical Health Relationship Safety Transportation

Baseline Self Sufficiency Risk Areas

Safe At Risk

Complex Picture of Potential Needs

We’ve had over 3,000 families take the Self-Sufficiency Matrix assessment of need as part of our case management programs across the community. Their scores paint a complex picture of core needs, with

  • ver 95% of households having at least one core social factor in the ‘Risk’ range of the assessment.

Two-Thirds of households assessed were at risk in areas of Health, Income, Food, Employment and Child Care.

slide-12
SLIDE 12
  • 4,885 of the highest risk individuals were served by

Boulder County supportive housing case management programs

  • 2,413 (or 50%) of these individuals were also members on

a child welfare abuse neglect referral

  • Only 385 children housed via HHS supportive housing

programs were active in a child welfare case at some point in their lifetime (7.8% of those served).

  • 31% reduction in the child welfare case’s length of service

if the SH program begins within 3 months of the welfare case opening.

  • 50% reduction in subsequent re-referral rates.

Prevention Opportunities

Boulder County uses a Coordinated Community Housing Resource Panel (CHRP) model with a common application and assessment to triage families in need of housing

  • supports. Referrals come from a network of seven community partners, as well as

from Child Welfare referrals. Most of the Child Welfare referrals come from Intake and the Early Intervention Team, although the Panel also takes open active case referrals. Data shows that Agile Response = Improved Outcomes

slide-13
SLIDE 13
  • Incentivize integration of health/housing/human services business units
  • Provide for regulatory waivers within integrating systems across sectors
  • Support SH targeted family homelessness program across HHS/HUD
  • Expand use of International Classification of Disease-10 codes for SDH to

support CQI and billing processes

  • Align regulatory compliance requirements to promote shift to value-based

activities

  • Share disaster/economic crisis lessons as component of system planning
  • Provide fiscal support for move to prevention/access/wellness
  • Support use of assessment tools, shared fiscal risk/reward models,

allocation of resources

  • Expand research-based information and sharing across jurisdictions

Building Healthy Thriving Communities: Opportunities and Lessons Learned

slide-14
SLIDE 14

THANK YOU, Q&A

Frank Alexander Director Boulder County Housing and Human Services 303-441-1405 falexander@bouldercounty.org