
SLIDE 1
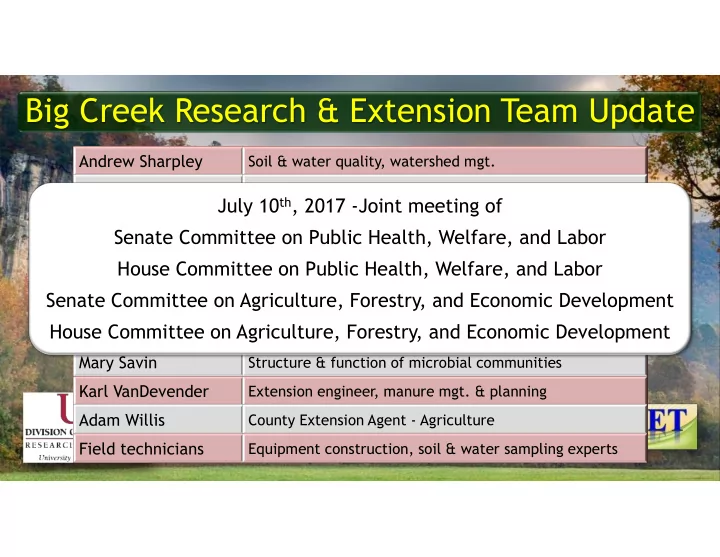
Big Creek Research & Extension Team Update
Andrew Sharpley
Soil & water quality, watershed mgt.
Brian Breaker (USGS)
Surface water specialist, trend assessment
Kris Brye
Soil physics, pedology, sustainability, nutrient leaching
Mike Daniels
Extension water quality & nutrient mgt. specialist
Ed Ggbur
Agricultural statistical design & determination
Brian Haggard
Ecological engineering, water quality monitoring
Phil Hays (USGS)
Karst hydrogeology and groundwater quality
Mary Savin
Structure & function of microbial communities
Karl VanDevender
Extension engineer, manure mgt. & planning
Adam Willis
County Extension Agent - Agriculture
Field technicians
Equipment construction, soil & water sampling experts