
SLIDE 1
BASIC PRINICPALS OF HIGH PERFORMANCE LIQUID CHROMATOGRAPHY Violeta - - PowerPoint PPT Presentation
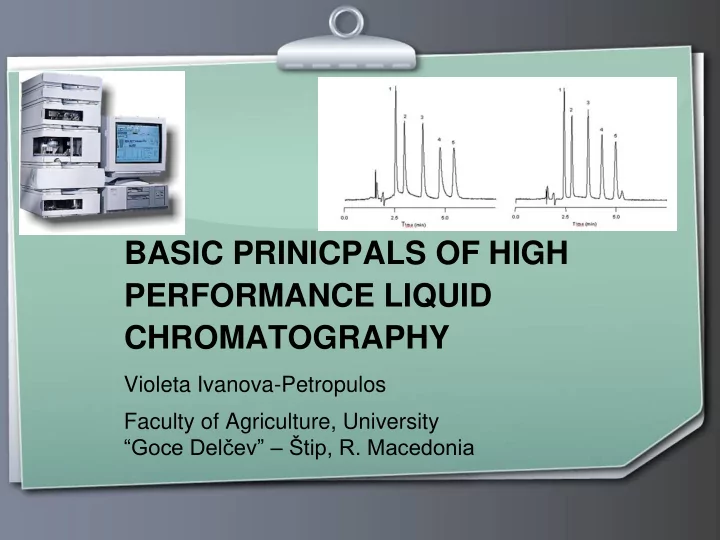
BASIC PRINICPALS OF HIGH PERFORMANCE LIQUID CHROMATOGRAPHY Violeta Ivanova-Petropulos Faculty of Agriculture, University Goce Delev tip, R. Macedonia What is liquid chromatography? Liquid chromatography (LC) is an analytical
Page 2
Page 3
Page 4
Page 5
Stationary phase
Page 6
dissolved in solution.
separation column, detector and data processor.
Page 7
Page 8
Page 9
Page 10
Page 11
Page 12
solvents are polar aqueous-organic mixtures such as methanol-water or acetonitrile-water.
Page 13
Page 14
Page 15
Page 16
Page 17
Concentration of methanol in eluent
Page 18
Page 19
Page 20
Page 21
243.4 276.5 348.0 528.0 357.4 515.9 276.5 345.7 525.6 290.8
AU 0.00 0.02 0.04 0.06 0.08 0.10 0.12 0.14 0.16 0.18 0.20 nm 250.00 300.00 350.00 400.00 450.00 500.00 550.00
Mv-Glc UV max = 528.0 nm Dp-Glc UV max = 525.6 nm Cy-Glc UV max = 520.7 nm Pt-Glc UV max = 525.6 nm Pn-Glc UV max = 515.9 nm
Page 22
Page 23
Page 24
Page 25
Page 26
(a) (b) 50 100 150 Intens. [mAU] 50 100 150 200 (c) (d) 10 20 30 40 10 20 30 40 Time [min] 50 20 40 1 2 3 4 4 5 4 6
Anthocyanin- p-coumaroylglucosides Anthocyanin- acetylglucosides Anthocyanin- monoglucosides
7 8 10 9 11 12 13
UV and visible chromatograms of polyphenols: (a) 280 nm, (b) 320 nm, (c) 360 nm, (d) 520 nm
Intens . (a) (b) (c) 1 2 3 4 5 1’ 2’ 3’ 4’ 5’ 1’’ 2’' 3’’ 4’’ 5’’ 1 2 3 4 0.0 1.0 x10⁸ 10 20 30 40 50 Time [min] 1 2 3 x107 x107
Extracted ion chromatograms at different m/z values, which correspond to the M+ signals of the anthocyanins
Page 27
Page 28
Intensity
200 300 400 500 600 700 800 900 1000 1100
m/z
5 10 15 20 25 30 35 40 45 50 55 60 65 70 75 80 85 90 95 100
425 407 451 289 559 [M-H-H2O]-
[M-H-170]- [M-H-152]- [M-H-126]-
O HO OH OH OH O OH OH OH OH OH OH
152 289
126
Page 29
Page 30
Page 31
Page 32
Page 33
Page 34