
SLIDE 1
1
HPLC as a Frontend to Mass Spectrometry in Proteomics
Biomedical Research Techniques November 8th 2017, Erasmus Medical Centre
Overview
- What is chromatography?
- Principles
- Basic layout
- Stationary phases
- Chromatography in Proteomics
- Samples
- Strategy
- NanoLC
- Applications
- Recent developments
- Summary
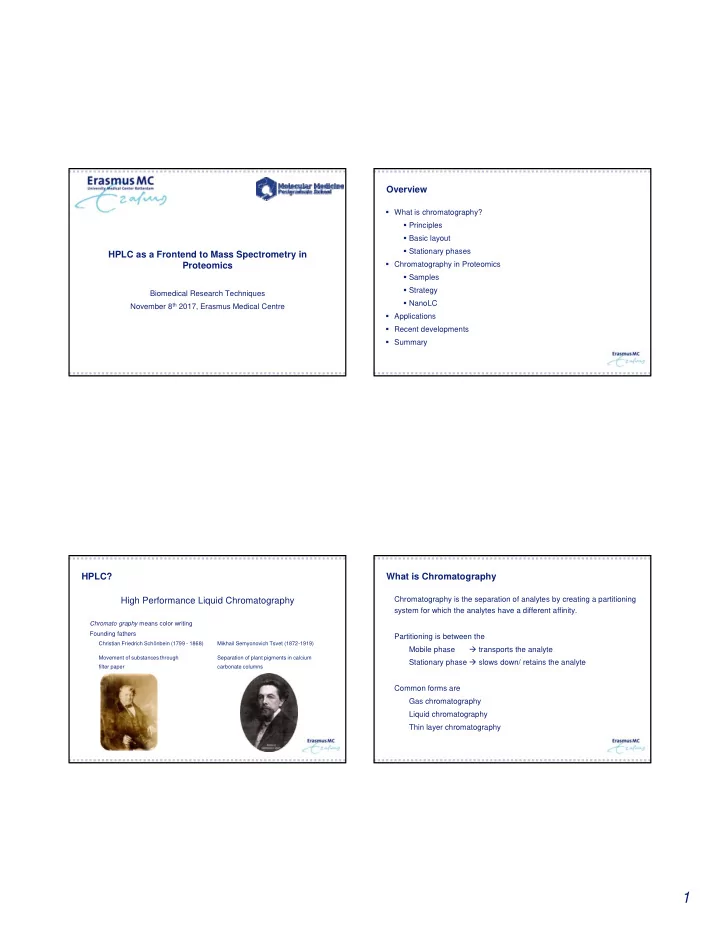
HPLC? High Performance Liquid Chromatography
- Chromato graphy means color writing
- Founding fathers
Christian Friedrich Schönbein (1799 - 1868) Mikhail Semyonovich Tsvet (1872-1919) Movement of substances through Separation of plant pigments in calcium filter paper carbonate columns
What is Chromatography
- Chromatography is the separation of analytes by creating a partitioning
system for which the analytes have a different affinity.
- Partitioning is between the
- Mobile phase
transports the analyte
- Stationary phase slows down/ retains the analyte
- Common forms are
- Gas chromatography
- Liquid chromatography
- Thin layer chromatography