
SLIDE 1
ATHABASCA OIL CORPORATION FOCUSED | EXECUTING | DELIVERING JANUARY - - PowerPoint PPT Presentation
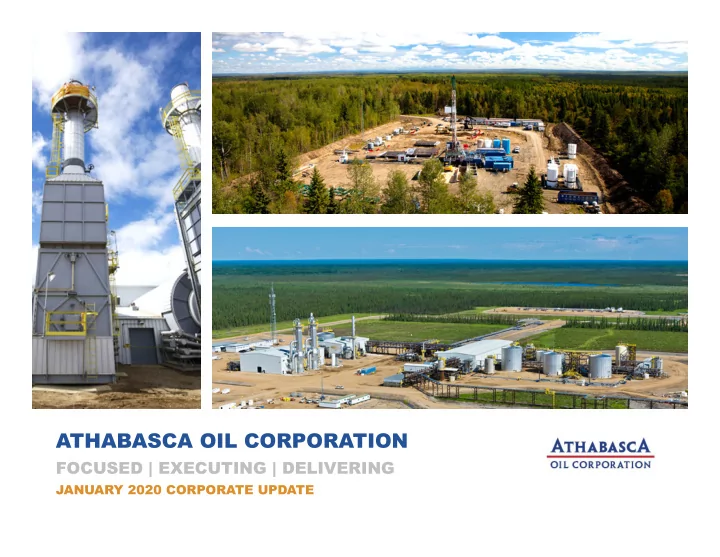
ATHABASCA OIL CORPORATION FOCUSED | EXECUTING | DELIVERING JANUARY 2020 CORPORATE UPDATE ATHABASCA PREMIER RESOURCE EXPOSURE LIGHT OIL 37,500 boe/d THERMAL OIL MONTNEY 88% liquids $600MM EV $335MM Liquidity HANGINGSTONE 90 year 2P
ATHABASCA OIL (TSX:ATH)
1
Footnotes and additional information included in the back as endnotes
ATHABASCA OIL (TSX:ATH)
10 20 30 40 2016 2017 2018 2019
mboe/d
Thermal Oil Light Oil
2
$25/boe
$486MM Light Oil JV with Murphy Oil $560MM Leismer Acquisition from Equinor $400MM Contingent Bitumen Royalty 2019 Capital Program Funded within Funds Flow Light Oil surpasses 10,000 boe/d Balance Sheet Refinancing with 5 year term $265MM Infrastructure Sale
*Corporate netback excludes hedging
$14/boe $19/bbl ‐$17/bbl $21/bbl ‐$5/bbl
ATHABASCA OIL (TSX:ATH)
100 200 300 2018 2019 2020
$MM
10 20 30 40 50 60 2018 2019 2020
mboe/d
Thermal Oil Light Oil
3
Capital offset by: $265MM infrastructure sale
Footnotes and additional information included in the back as endnotes
100 200 300 2018 2019 2020
$MM
US$57.50 US$60 US$65 US$70
ATHABASCA OIL (TSX:ATH)
4
*Capital excludes ~$9MM of capitalized G&A Footnotes and additional information included in the back as endnotes
WTI (US$) $55 $60 $65 $70 $15.00 $130 $185 $230 $275 $17.50 $95 $155 $200 $245 $20.00 $65 $120 $170 $210 WCS Diff (US$) $55 $60 $65 $70 $15.00 2.0x 1.3x 1.0x 0.7x $17.50 2.7x 1.7x 1.2x 0.9x $20.00 3.6x 2.1x 1.5x 1.1x WCS Diff (US$)
ATHABASCA OIL (TSX:ATH)
50 100 150 200 250 300 350 400 Jul Aug Sep Oct Nov Dec Jan Feb Mar Apr May Jun Jul Aug Sep Oct Nov Dec Jan 2018 2019 2020
mbbl/d
5
Source: Peters & Co. Research – North American Crude Oil Outlook (01‐06‐2020)
Source: Canadian Energy Regulator & RBN Energy Inc. *Other includes Express, Rangeland and Trans Mountain pipelines. **WCSB oil volumes net of domestic refinery demand.
ATHABASCA OIL (TSX:ATH)
6
Enbridge Waupisoo Enbridge South Cheecham Terminal
Edmonton Hardisty
Storage 130,000 bbl for apportionment management Trans Mountain Expansion 20,000 bbl/d 2022+ International markets TC Energy Keystone USGC (PADD III) 7,200 bbl/d TC Energy Keystone XL 25,000 bbl/d 2022+ Enbridge Mainline Mid‐west (PADD II) (common carrier line) DILBIT SALES EXPOSURE*
US Gulf Coast ~20% Alberta WCS ~60% Hedged WCS Diff ~20%
*Q4/20 dilbit sales exposure ** 8,000 bbl/d protected from apportionment through direct sales to refineries
ATHABASCA OIL (TSX:ATH)
7
Peters & Co. Research – Oil Price Sensitivities (12‐20‐2019). Upside US$65 WTI, Base US$58 WTI, US$18 WCS diffs * 2020 valuation and debt metrics based on upside pricing scenario. ATH share price $0.51.
Footnotes and additional information included in the back as endnotes
ATHABASCA OIL (TSX:ATH) 9
Wells ATH Montney Licensed Montney
16‐30 Pad 6 wells 2‐5 Pad 4 wells
Footnotes and additional information included in the back as endnotes
ATHABASCA OIL (TSX:ATH)
20 40 60 80 100 120 140 30 60 90 120 150 180 210 240 270 300 330 360 Condensate Production (Mbbl) Days
Gen 1 Gen 2 Gen 3 (facility restricted wells) Gen 3 (unrestricted wells) Internal Type Curve
~25 bbl/mmcf plant recovered NGLs included in IPs & EURs
200 – 300 bbl/mmcf initial free liquids cuts (~60% liquids) 10
Flat long term pricing assumed in internal type well economics US$7.50 MSW diff, C$1.50 AECO, 0.75 FX
Rate Sales Gas C5+ liquids
boe/d mmcf/d bbl/d %
IP30 1,000 2.6 501 57% IP90 875 2.4 421 55% IP365 600 1.8 262 49%
mboe bcf mbbl %
EUR 675 2.2 246 45%
US$WTI
$55 $60 $65 Well Cost
$MM
~$8MM drill & completed (2,750m hz) Payback
months
26 21 18 IRR BT
%
35% 49% 64% NPV10 BT
$MM
$2.6 $3.8 $4.9 Netback
$/boe
$25.25 $28.25 $31.25 PDP F&D
$/boe
11.8 $11.75 $11.75 Recycle Ratio
x
2.1 2.4 2.7 Cap Effcy (IP365)
$/boed
12985.5 $12,985 $12,985
Footnotes and additional information included in the back as endnotes
ATHABASCA OIL (TSX:ATH) KAYBOB EAST SIMONETTE
*IPs rounded to the nearest 25 boe/d with volumes adjusted for shrinkage. Two Creeks and Kaybob West wells not tied into permanent infrastructure with liquids currently trucked. Upcoming wells & next phase of activity (# of wells per pad)
KAYBOB NORTH
#
11 KAYBOB WEST TWO CREEKS SAXON
1 1 2 2 2 1
16‐25 well* IP30 ~750 boe/d (91% liquids) IP120 ~650 boe/d (90% liquids) Legend Volatile Oil Window (>400 bbl/mmcf initial CGR) Gas Condensate Window (<400 bbl/mmcf initial CGR) Industry Duvernay Hz Wells ATH Duvernay Hz Wells 2 2 1 3 well pad (8‐3) – IP avg per well IP30 ~1,600 boe/d (89% liquids) IP60 ~1,300 boe/d (88% liquids) 2 well pad (16‐29)* – IP avg per well IP30 ~775 boe/d (93% liquids) IP120 ~625 boe/d (93% liquids) 2 well pad (5‐19)* – IP avg per well IP30 ~675 boe/d (95% liquids) IP90 ~500 boe/d (94% liquids)
Footnotes and additional information included in the back as endnotes
ATHABASCA OIL (TSX:ATH) 12
Single well economics at $6.75MM D&C. Flat long term pricing (US$60 WTI, US$5 C5+ diff, C$1.50 AECO, 0.75 FX Footnotes and additional information included in the back as endnotes
3 WELL PAD (8‐3) IP AVG PER WELL 2 WELL PAD (5‐16) IP AVG PER WELL 4 WELLS (16‐29 & 5‐19) IP AVG PER WELL ESB AVERAGE (120 WELLS) 16‐25 NORTHERN STEP‐OUT KAYBOB WEST & EAST (26 WELLS) ESB TOP QUARTILE
ATHABASCA OIL (TSX:ATH)
14
Breakevens reflect 2020e production, US$17.50 WCS diff, US$5 C5 diff, C$1.75 AECO, 0.75 FX Footnotes and additional information included in the back as endnotes
ATHABASCA OIL (TSX:ATH)
15
PAD 8N PAD 8N PAD 8S PAD 8S PAD 1 PAD 1 PAD 2 PAD 2 PAD 7 PAD 7 PAD 4 PAD 4 PAD 3 PAD 3 PAD 6 PAD 6 PAD 6 PAD 6
Existing Surface Pads Existing Drainage Areas Pad L7 High : 40 Low : 10 Pad L8N Pad L8S
CPF CPF
ATHABASCA OIL (TSX:ATH)
17
Sources: CAPP, IEA, “Global carbon intensity of crude oil production” published Aug 2018 in Science Mag
China 24% US 13% EU 7% India 7% Russia 4% Japan 3% Canada <1.5% Australia 1% Other 40%
ATHABASCA OIL (TSX:ATH)
18
ATHABASCA OIL (TSX:ATH)
Sources: National Pollutant Release Inventory, Alberta Directive 54 filings, ARC Energy Research Institute, Alberta Energy Regulator.
19 Alberta Liability Management Rating (LMR) 16.0 94% of Thermal Oil reservoir water recycled for steam generation
ATHABASCA OIL (TSX:ATH) 0.0 0.2 0.4 0.6 0.8 1.0 1.2 1.4 1.6 1.8
TRIF
20
TRIF = Total Reportable Injury Frequency TRIF peer data sourced from CAPP
Fox Creek Hospital
Lac La Biche Hospital
ATHABASCA OIL (TSX:ATH)
21
ATHABASCA OIL (TSX:ATH)
23
Q3/19 Net debt = FV term debt + (Current Liabilities ‐ Current Assets adj. for risk management contracts) Q3/19 Funding capacity = cash & equivalents + available credit facilities + Duvernay capital carry Liquidity = cash & equivalents + available credit facilities
As of January 7, 2020 2020 Q1 2020 Q2 2020 Q3 2020 Q4 2020 WTI / WCS Differential Volume Price C$ Price US$ Volume Price C$ Price US$ Volume Price C$ Price US$ Volume Price C$ Price US$
Financial Swaps 9,659 (26.82) (20.17) 10,000 (25.12) (18.89) 10,000 (25.58) (19.23) 8,000 (26.03) (19.57)
WTI Swap Volume Price C$ Price US$ Volume Price C$ Price US$ Volume Price C$ Price US$ Volume Price C$ Price US$
Financial Swaps 12,000 76.68 57.66 9,000 75.97 57.12 3,000 73.19 55.03 3,000 73.19 55.03 Collars 1,000 65.84‐79.80‐86.45 49.50‐60.00‐65.00 1,000 65.84‐79.80‐86.45 49.50‐60.00‐65.00 1,000 65.84‐79.80‐86.45 49.50‐60.00‐65.00 1,000 65.84‐79.80‐86.45 49.50‐60.00‐65.00 3,000 65.84‐73.15‐79.80 49.50‐55.00‐60.00 3,000 65.84‐73.15‐79.80 49.50‐55.00‐60.00 3,000 65.84‐73.15‐79.80 49.50‐55.00‐60.00 3,000 65.84‐73.15‐79.80 49.50‐55.00‐60.00 2,000 66.17‐73.15‐79.80 49.75‐55.00‐60.00 2,000 66.17‐73.15‐79.80 49.75‐55.00‐60.00 2,000 66.17‐73.15‐79.80 49.75‐55.00‐60.00 2,000 66.17‐73.15‐79.80 49.75‐55.00‐60.00 3,000 73.15‐79.80‐86.78 55.00‐60.00‐65.25
Canadian price is based on an FX rate of 1.33
ATHABASCA OIL (TSX:ATH)
24
Robert Broen, P.Eng. President & Chief Executive Officer Matt Taylor, CFA Chief Financial Officer Angela Avery General Counsel & VP Business Development Karla Ingoldsby, P. Eng. VP Thermal Oil Mike Wojcichowsky, P. Eng. VP Light Oil Ronald Eckhardt Chair of the Board, member of the Reserves Committee Robert Broen, P.Eng. President & Chief Executive Officer Bryan Begley Chair of the Compensation & Governance Committee and member of the Reserves Committee Anne Downey, P. Eng. Chair of the Reserves Committee Thomas Ebbern Member of the Compensation & Governance Committee and member of the Audit Committee Carlos Fierro Member of the Compensation & Governance Committee and member of the Audit Committee Marshall McRae, CA Chair of the Audit Committee
ATHABASCA OIL (TSX:ATH)
Slide Endnotes
Multi‐year outlook price assumptions: 1 (1) Liquidity = cash & equivalents + available credit facilities (2) Consolidated reserves as at December 31, 2018 evaluated by McDaniel & Associates Consultants Ltd. (3) Reserve life index calculated on corporate 2P reserves of 1,280mmboe and ~40,000 boe/d production (4) For additional information regarding Athabasca’s reserves and resources estimates, please see “Independent Reserve and Resource Evaluations” in the Company’s 2018 Annual Information Form which is available on Company’s website or on SEDAR www.sedar.com 2/3/4/7/23 (1) Historical financial and operating results found on Company’s website or on SEDAR www.sedar.com (2) Liquidity = cash & equivalents + available credit facilities (3) Netbacks = operating netbacks prior to realized hedging gains (losses) and other income (4) FCF = funds flow – capital expenditures (5) Net debt = FV term debt + Current Liabilities (adj. for risk management) ‐ Current Assets (adj. for risk management) (6) 2020e Net Debt to EBITDA = Forecasted year‐end net debt / forecasted EBITDA 9/10/11/12 (1) Gross Montney inventory based on management estimate of 4 wells per section Gross Duvernay acres and inventories. Well inventory based on management estimate of 4‐6 wells per section and ~2,750m laterals. See reader advisory “Drilling Locations” for more detail (2) Operating netback is prior to realized hedging gains (losses) and other income 14 (1) Thermal Oil reserve life index calculated on 852mmbbl 2P reserves (Leismer & Hangingstone) and 29,000 bbl/d production (2) Thermal Oil McDaniel & Associates Consultants Ltd. reserve evaluation as at December 31, 2018 (675mmboe Leismer, 177mmboe Hangingstone, 353mmboe Corner)
25
2018 2019e 2020e WTI US$/bbl $65.50 $55.75 $57.50 FX C$/US$ 0.77 0.75 0.75 Heavy Diff US$/bbl
WCS C$/bbl $50.61 $58.00 $53.25 MSW Diff US$/bbl
MSW (Ed. Par. Light Oil) C$/bbl $70.27 $67.25 $70.00 C5 Diff US$/bbl
Condensate C$/bbl $79.34 $68.00 $70.00 AECO C$/mcf $1.48 $1.65 $1.75
ATHABASCA OIL (TSX:ATH) 26
Forward Looking Statements This Presentation contains forward‐looking information that involves various risks, uncertainties and other factors. All information other than statements of historical fact is forward‐looking information. The use of any
The forward‐looking information is not historical fact, but rather is based on the Company’s current plans, objectives, goals, strategies, estimates, assumptions and projections about the Company’s industry, business and future operating and financial results. This information involves known and unknown risks, uncertainties and other factors that may cause actual results or events to differ materially from those anticipated in such forward‐looking information. No assurance can be given that these expectations will prove to be correct and such forward‐looking information included in this Presentation should not be unduly relied upon. This information speaks only as of the date of this Presentation. In particular, this Presentation contains forward‐looking information pertaining to, but not limited to, the following: the Company’s 2019 and 2020 guidance and multi‐year outlook; type well economic metrics; estimated recovery factors and reserve life index; and other matters. Information relating to "reserves" is also deemed to be forward‐looking information, as it involves the implied assessment, based on certain estimates and assumptions, that the reserves described exist in the quantities predicted or estimated and that the reserves can be profitably produced in the future. With respect to forward‐looking information contained in this Presentation, assumptions have been made regarding, among other things: commodity outlook; the regulatory framework in the jurisdictions in which the Company conducts business; the Company’s financial and operational flexibility; the Company’s, capital expenditure outlook, financial sustainability and ability to access sources of funding; geological and engineering estimates in respect of Athabasca’s reserves and resources; and other matters. Actual results could differ materially from those anticipated in this forward‐looking information as a result of the risk factors set forth in the Company’s Annual Information Form (“AIF”) dated March 6, 2019 that is available on SEDAR at www.sedar.com, including, but not limited to: fluctuations in commodity prices, foreign exchange and interest rates; political and general economic, market and business conditions in Alberta, Canada, the United States and globally; changes to royalty and tax regimes, environmental risks and hazards; the potential for management estimates, assumptions and regulatory interpretations to be inaccurate; the dependence on Murphy as the operator of the Company’s Duvernay assets; the capital requirements of Athabasca’s projects and the ability to obtain financing; operational and business interruption risks; failure by counterparties to make payments or perform their operational or other obligations to Athabasca in compliance with the terms of contractual arrangements; aboriginal claims; failure to obtain regulatory approvals or maintain compliance with regulatory requirements; uncertainties inherent in estimating quantities of reserves and resources; litigation risk; environmental risks and hazards; reliance on third party infrastructure; hedging risks; insurance risks; claims made in respect of Athabasca’s operations, properties or assets; risks related to Athabasca’s amended credit facilities and senior secured notes; and risks related to Athabasca’s common shares. For important additional information regarding Athabasca’s reserves and resources estimates and the evaluations that were conducted by McDaniel & Associates, please see “Independent Reserve and Resource Evaluations” in the Company’s most recent AIF. The forward‐looking statements included in this presentation are expressly qualified by this cautionary statement. The forward looking statements contained herein are made as of the date hereof and Athabasca does not undertake any obligation to publicly update or revise any forward‐looking statements except as required by applicable securities laws. Drilling Locations: The 800 Duvernay drilling locations referenced include: 50 proved undeveloped or non‐producing locations and 35 probable undeveloped locations for a total of 85 booked locations with the balance being unbooked locations. The 200 Montney drilling locations include: 77 proved undeveloped locations and 12 probable undeveloped locations for a total of 89 booked locations with the balance being unbooked
2018 and account for drilling locations that have associated proved and/or probable reserves, as applicable. Unbooked locations are internal management estimates. Unbooked locations do not have attributed reserves
based on evaluation of applicable geologic, seismic, engineering, production and reserves information. There is no certainty that the Company will drill all unbooked drilling locations and if drilled there is no certainty that such locations will result in additional oil and gas reserves, resources or production. The drilling locations on which the Company will actually drill wells, including the number and timing thereof is ultimately dependent upon the availability of funding, oil and natural gas prices, provincial fiscal and royalty policies, costs, actual drilling results, additional reservoir information that is obtained and other factors. Additional Oil and Gas Information: “BOEs” may be misleading, particularly if used in isolation. A BOE conversion ratio of six thousand cubic feet of natural gas to one barrel of oil equivalent (6 Mcf: 1 bbl) is based on an energy equivalency conversion method primarily applicable at the burner tip and does not represent a value equivalency at the wellhead. As the value ratio between natural gas and crude oil based on the current prices of natural gas and crude oil is significantly different from the energy equivalency of 6:1, utilizing a conversion on a 6:1 basis may be misleading as an indication of value. Test Results and Initial Production Rates: The well test results and initial production rates provided in this presentation should be considered to be preliminary, except as otherwise indicated. Test results and initial production rates disclosed herein may not necessarily be indicative of long term performance or of ultimate recovery. Non‐GAAP Financial Measures: The "Adjusted Funds Flow”, "Light Oil Operating Income", “Light Oil Operating Netback”, “Light Oil Capital Expenditures Net of Capital‐Carry”, "Thermal Oil Operating Income", "Thermal Oil Operating Netback", “Consolidated Operating Income”, “Consolidated Operating Netback”, “Consolidated Capital Expenditures Net of Capital‐Carry” and “Net Debt” financial measures contained in this Presentation do not have standardized meanings which are prescribed by IFRS and they are considered to be non‐GAAP measures. These measures may not be comparable to similar measures presented by other issuers and should not be considered in isolation with measures that are prepared in accordance with IFRS. Complete definitions are outlined in the Company’s Q3 2019 MD&A and financials available on SEDAR (www.sedar.com) or the Company’s website (www.atha.com) .