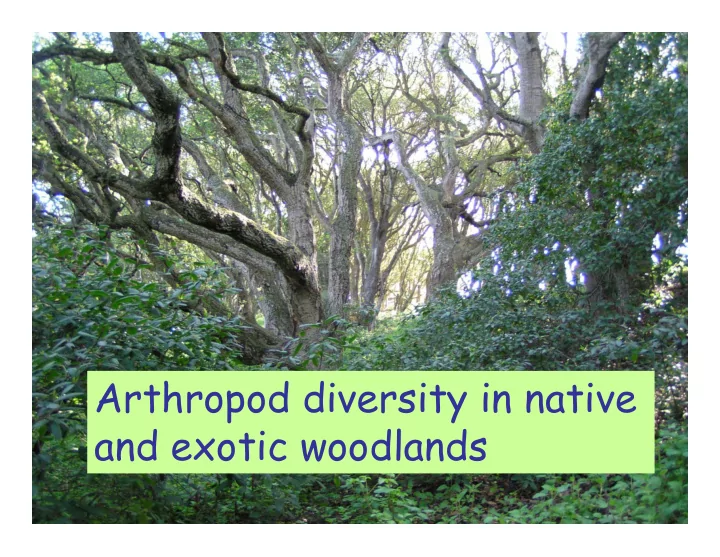
Arthropod diversity in native and exotic woodlands What is an - - PowerPoint PPT Presentation
Arthropod diversity in native and exotic woodlands What is an arthropod? Chitinous exoskeleton Paired jointed appendages Segmented body Why use arthropods for assessing habitat value? Extremely abundant and diverse (75% of
What is an arthropod?
- Chitinous exoskeleton
- Paired jointed appendages
- Segmented body
- Extremely abundant and diverse (75% of all animal
species)
- Many taxa are well known
- Easy to sample
- Conspicuous in all trophic levels – e.g. herbivores,
predators, decomposers.
- Sensitive to environmental disturbance
Why use arthropods for assessing habitat value?
What part of habitat to sample?
Field methods - Pitfall traps
Captures surface-active, larger terrestrial arthropods (e.g. beetles, spiders, ants, isopods)
Field methods - Sticky traps
Samples aerial insects and those associated with foliage
Field methods –Trap placement
- One pitfall and sticky
trap at center and edge
- f each site
- Traps deployed for one
week
Field methods – Winkler (litter) traps
Captures slower-moving, arthropods hidden within litter layer (ants, springtails, mites), some of which are not caught in pitfall traps.
Sorting and identification
Arthropods keyed to level of order
Arthropods recovered in traps
- Arachnida
– Acari (mites) – Araneae (spiders)
- Chilopoda (centipedes)
- Diplopoda (millipedes)
- Isopoda (sowbugs, etc.)
- Insecta
– Collembola (springtails) – Coleoptera (beetles) – Diptera (flies) – Hymenoptera (ants, wasps, etc.)
Arachnids – Spiders and mites
Oribatid mite. Courtesy of Alan Hadley Lycosid spider. Courtesy of Iziko Museums of Cape Town
Other arthropods- Myriapods and isopods
Centipede (Geophilimorpha) (left) and sowbug (Isopoda). Courtesy of Humboldt State Univ Natural History Museum
Insects – Springtails (Collembola)
Image courtesy of Alan Hadley Image courtesy of John Van Dyk, Iowa State University Department of Entomology
Insects – Flies (Diptera) and beetles (Coleoptera)
Leaf Miner Fly (Diptera). Courtesy of John Haarstad, Insects of Cedar Creek Insect Survey Courtesy of John Haarstad, Insects
- f Cedar Creek Insect Survey
Insects- Wasps and ants (Hymenoptera)
University of Missouri and Sarah Heyman and Jan Weaver Formicidae (Temnothorax sp.) Courtesy of California Acad. Sciences
Rarefaction curve – Oak and eucalyptus
2 4 6 8 10 12 14 16
Order Richness
200 400 600 800 1000 1200 1400 1600 1800
Abundance
- ak
euc
Still more taxa to be uncovered, slightly more so for oak
Ecosim 7.0 (Gotelli & Entsminger 2002)
Rarefaction curve – Oak and eucalyptus
2 4 6 8 10 12 14 16
Order Richness
200 400 600 800 1000 1200 1400 1600 1800
Abundance
95% conf, oak
- ak
euc
Eucalyptus crossing below oak lower confidence limit
Ecosim 7.0 (Gotelli & Entsminger 2002)
Results - Pitfall and sticky traps Taxonomic summary
- Three orders account for majority of arthropods in
- ak and eucalyptus:
– Collembola (springtails), – Acari (mites) – Diptera (flies)
- Less abundant orders:
– Coleoptera (beetles) and Araneae (spiders) are less than 10%
- f total
– many orders are rare (1% or less)
- 17 orders associated with oak and/or eucalyptus
habitats
Order abundances – Oak and eucalyptus
Order
Oak Euc
Collembola (springtails) 519 589 Thysanura (bristletails, etc.) 1 1 Orthoptera (crickets, etc.) 2 Homoptera (aphids, etc) 6 11 Psocoptera (barklice) 7 11 Diptera (flies) 255 864 Lepidoptera (moths, butterflies) 1 Thysanoptera (thrips) 4 7 Coleoptera (beetles) 146 48 Hymenoptera (ants, wasps, etc.) 16 13 Polyxenida (bristle millipedes) 2 Julida (common millipedes) 1 Lithobiomorpha (centipedes) 1 Acari (mites) 406 295 Araneae (spiders) 58 32 Pseudoscorpions 1 1 Isopoda (sowbugs, etc.) 7 Unknown 19 9
** *
ANOVA, *P < .05; **P < .02)
Order abundances – Oak and eucalyptus
- 100
100 200 300 400 500 600 700 800 900
Oak
- 100
100 200 300 400 500 600 700 800 900
Euc
Y = 26.914 + .51 * X; R^2 = .629
Total abundances (of orders) correlate fairly well in two habitats (i.e. rare in both euc and oak, or abundant in both).
Average abundance of top orders
10 20 30 40 50 60 70 80 90 100
Diptera Collemb. Acari
- Coleopt. Araneae Hymenopt.
- ak
euc
Abundance
** *
ANOVA, *P< .05; **P < .02)
Overall habitat comparisons
Order richness
average per sample
No significant different between woodland types (ANOVA, P>.05).
2 4 6 8
euc
- ak
Overall habitat comparisons
50 100 150 200
euc
- ak
Abundance greater in eucalyptus groves than in
- ak woodlands (ANOVA, P>.05).
Total abundance
average per sample
Overall habitat comparisons
Diversity (Shannon-Weaver)
average per sample
Diversity is greater in oaks- i.e. same number of orders but more evenly spread in oaks than eucs (ANOVA, P>.05).
.2 .4 .6
euc
- ak
- Sax (2002) surveyed arthropod diversity of
native (oak and bay) and eucalyptus woodlands.
– equal species richness (approximately 40 sp. in each habitat). – About half of species were shared by both woodland types. – Species composition was different between woodland types. – Eucs had higher invertebrate diversity than native woodlands (spring only).
Previous research on native and eucalyptus woodlands
Comparison of two studies
- Taxa richness equal in eucs and native
woodlands
– Order richness (present study) and species richness (Sax study)
- Diversity results differ
– oaks have higher diversity than eucs (present
study) while Sax detected higher diversity in eucs
Center vs edge habitats -Taking a closer look
Center vs edge
No significant difference between oak and eucalyptus for either center or edge (2-way ANOVA, P>.05).
2 4 6 8
- ak
euc
center edge
Order richness
average per sample
Center vs edge
Although not significant, eucs have higher arthropod abundance than oaks, particularly at edges (2-way ANOVA, P>.05).
50 100 150
200
250
center edge
- ak
euc
Total abundance
average per sample
Center vs edge
Although not significant, oaks have higher arthropod diversity than eucs in center of woodlot (2-way ANOVA, P>.05).
.2 .4 .6 .8
center edge
- ak
euc
Diversity (Shannon-Weaver)
average per sample
- Order richness is equal in oak and eucalyptus
woodlands.
- Abundance greater in eucs, especially at edges.
- Diversity is higher in oaks, particularly in center.
- More samples might improve accuracy of estimation
- f diversity and abundance.
Summary – Overall habitat comparisons
- Focus on one or a few groups only (e.g. beetles, ants)
– Orders abundant in all trophic levels
- More samples over several seasons
– Limited sampling and early in season (need more replicates)
- Winkler trap data was not included in analysis
– Captures a different suite of arthropods
- Keying to species is important in arthropod diversity
studies
– Morphospecies- surrogate for species
Future directions
Acknowledgements
- Kerstin Wasson
- Eric Van Dyke
- Joshua Salisbury
- Sondra Schreibman
- Diana Wakimoto
Order richness split by woodlot size
In big woodlots eucs have slightly higher order richness while in small woodlots, oaks have somewhat higher order counts (2-way ANOVA, P>.05).
2 4 6 8
big small
- ak
euc
Total abundance split by woodlot size
Euc groves have slightly higher arthropod abundance, regardless of woodlot size (2-way ANOVA, P>.05)
50
100 150 200 250
big small
- ak
euc
Diversity (Shannon-Weaver) split by woodlot size
Diversity in big and small euc groves similar, small oak groves have slightly higher diversity than big groves (2-way ANOVA, P>.05)
.2 .4 .6 .8
big small
- ak
euc