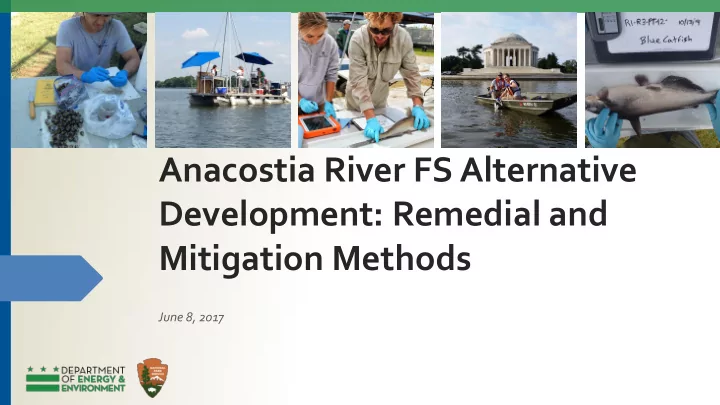

Anacostia River FS Alternative Development: Remedial and Mitigation Methods June 8, 2017
Agenda How Have Other Rivers Been Cleaned? What Are the Anacostia’s Unique Challenges? Anacostia CSM-Sedimentation, Contamination, Sources Conceptual Remedial Alternative Approaches Questions
Summary of Clean-up Approach at Other Contaminated Sediment Sites Superfund Cubic yards Approach Cost Disposal of Dredged Sediment Site dredged Duwamish -dredging or partial dredging and capping 960,000 $342,000,000 Offsite at permitted landfill -capping w/ possible activated carbon amendment -enhanced natural recovery (capping with 6-9 inches of clean material) -long term monitoring -institutional controls Hudson River -dredging 2,650,000 $460,000,000 Offsite at permitted landfill -backfill with 1 foot of clean material to isolate residual contamination where appropriate -long term monitoring -institutional controls Passaic River -dredging 4,300,000 $1,730,000,000 Offsite at permitted landfill and -engineered cap (sand and armor) incineration of sediment -long term monitoring deemed hazardous under RCRA 588,000 $506,100,000 Offsite thermal treatment and Gowanus -dredging Canal -in situ stabilization of NAPL impacted native soils disposal at permitted landfill -multi-layer cap: treatment, isolation, and armor layers -barrier or interception system at boundary of excavation in turning basin -long term monitoring -institutional controls
Summary of Clean-up Approach at Other Contaminated Sediment Sites Superfund Cubic yards Disposal of Dredged Approach Cost Site dredged Sediment Onondaga -dredging or partial dredging and capping 2,200,000 $450,000,000 Near shore CDF/landfill Lake -capping (425 acres) -enhanced natural recovery (150 acres in deeper water) -long term monitoring -institutional controls Ottawa River 250,000 $50,000,000 Near shore landfill for non- -dredging TSCA sediment -long term monitoring -institutional controls Offsite for TSCA sediment (about 10% total volume)
Anacostia Unique Challenges Urban River-What is Background? Remediation Goals- What is Clean? Small Watershed- Not Enough Water Potential for Recontamination Multiple RP Consent Orders National Park Requirements Limited Space for Handling Dredge Spoils Continued Need for Federal Navigation Channel ?
The Anacostia River Development The Anacostia River drains 176 square miles; mostly in Montgomery and Prince George’s Counties in Maryland. The study area is the lower nine mile tidal area Includes Washington Channel and Kingman Lake Watershed Map Study Area Map Source: Anacostia Watershed Society
Anacostia River Watershed Upstream of Study Area Supplies the Majority of Sediment • 85% sediment load to river • TSS loading estimate at 48,200 tons/year
The Anacostia River is TSS Perfectly “Designed” to TSS Settle Sediment in Coarse grain Sediment deposition Reach 1,2, and 3 Fine grain sediment acts as a “conveyor belt” to lower reaches Heavy deposition area – 90% of sediment deposited Deposition rate estimated at 3-7 cm/year (1.2-2.8 inches/year)
Recent Cesium Samples Confirm Deposition Rate in “Catcher’s Mitt” Area
Recent Cesium Samples Confirm Deposition Rate in “Catcher’s Mitt” Area
Major Contaminants of Concern 11 PCBs- 11.8 ppm maximum, Cove near PEPCO Draft PRG-676 ppb Dioxin-0.71 ppb, near Kenilworth and PEPCO Draft PRG-0.025 ppb Total PAHs- 1981.6 ppm; off Washington Gas facility Draft PRG-22.8 ppm Pesticides (Chlordane)- 4800 ppb, near Navy Yard Draft PRG-17.6 ppb Mercury- 380 ppm maximum, end of Washington Channel Draft PRG- 1.1 ppm Arsenic- 62 ppm maximum, downstream of PEPCO Draft PRG- 13.3 ppm B(a)P-76 ppm, off Washington Gas facility Draft PRG- 4.13 ppm
Contaminant Profile- Animations PCBs Chlordane
NPS Preliminary CSM High sedimentation rate in “Catcher’s Mitt” Historic contamination effectively buried Active sources for pesticides may still remain in Watershed
Overview of Feasibility Study Process Identification of Technologies Development of a Range of Alternatives Screening Alternatives to Maintain Range Evaluation of Alternatives Screening of Alternatives against CERCLA nine criteria
Technologies are Normally Grouped by Activity Removal Technologies- tracked excavators, clamshell dredges, hydraulic dredges (e.g., MudCat) etc. Transportation Technologies- haul truck, barges, rail, waterline etc. Disposal Technologies- landfill, CAD, CDF, ocean disposal etc. Capping Technologies- Sand caps, organoclay caps, activated carbon caps etc. Mitigation Technologies- ? ( not typically included in remedial alternatives )
Compliance with ARARs is one of the Nine CERCLA Criteria's Threshold Criteria 1. Overall protection of human health and the environment 2. Compliance with ARARs (applicable or relevant and appropriate standards) Primary Balancing Criteria 3. Long-term effectiveness and permanence 4. Reduction of toxicity, mobility or volume 5. Short-term effectiveness 6. Implementability 7. Cost Modifying Criteria 8. State acceptance 9. Community acceptance
Non- Impairment Standard Reestablish and sustain the functionality of the river system including channel stability, wetlands and wildlife habitat, riparian vegetation communities, scenery, resiliency, aesthetic values, and other components of the river system that have been impaired by the release of hazardous substances, that may be impaired by additional releases of hazardous substances, or that may be impaired by remedial action responding to releases or threatened releases of hazardous substances.
Feasibility Study - Potential Range of Alternatives Alternative 1 - No-Action Alternative 2 - Minimal Action (Hot Spot removals) Alternative 3 - Capping/Dredging Alternative 4 - Capping/Dredging (more extensive) Alternative 5 - Complete Removal
Alternative 2 – Hot Spot Removal Hot Spot removal and disposal Interim Remedial Measures? Where would the contaminants be disposed? Will this alternative be protective and comply with ARARs? Least costly alternative Adaptive Management?
Alternatives 3&4 - Dredging/Capping Would be developed per River Reach Extent of Capping may need to be based on need for Federal Navigation Channel Concern for recontamination Where would the contaminants be disposed? What we have to do to ensure alternative is protective and comply with ARARs? Costs can be significant Adaptive Management?
Alternative 5 - Complete Removal Complete dredging in all reaches Mitigation needs may be extensive for ARAR compliance Excessive volume – significant transportation issues Highest cost alternative Significant concern for recontamination
Questions?
Recommend
More recommend