AN EXPERIMENTAL STUDY ON STRAIN DISTRIBUTION OF BONDED JOINT UISNG - - PDF document

an experimental study on strain distribution of bonded
SMART_READER_LITE
LIVE PREVIEW

AN EXPERIMENTAL STUDY ON STRAIN DISTRIBUTION OF BONDED JOINT UISNG - - PDF document

18 TH INTERNATIONAL CONFERENCE ON COMPOSITE MATERIALS AN EXPERIMENTAL STUDY ON STRAIN DISTRIBUTION OF BONDED JOINT UISNG OPTICAL FIBER SENSOR Hyuk-Jin Yoon 1 *, Jung-Seok Kim 1 , Kwang-Yong Song 2 , Woo-Geun Lee 1 1 Korea Railroad Research


slide-1
SLIDE 1

18TH INTERNATIONAL CONFERENCE ON COMPOSITE MATERIALS

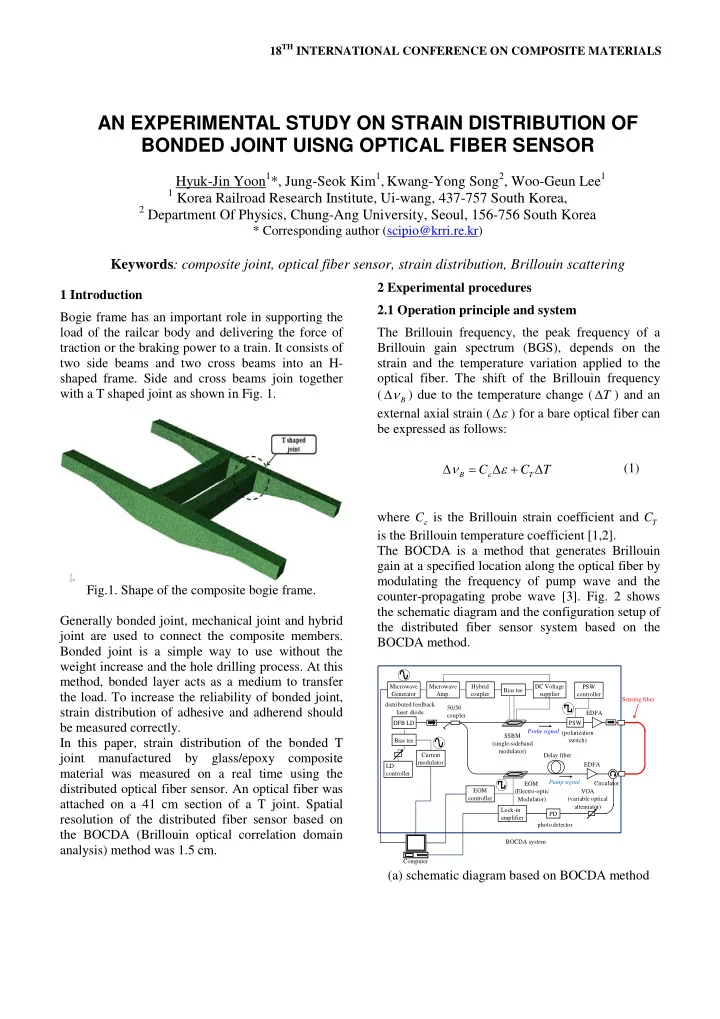
1 Introduction Bogie frame has an important role in supporting the load of the railcar body and delivering the force of traction or the braking power to a train. It consists of two side beams and two cross beams into an H- shaped frame. Side and cross beams join together with a T shaped joint as shown in Fig. 1. Fig.1. Shape of the composite bogie frame. Generally bonded joint, mechanical joint and hybrid joint are used to connect the composite members. Bonded joint is a simple way to use without the weight increase and the hole drilling process. At this method, bonded layer acts as a medium to transfer the load. To increase the reliability of bonded joint, strain distribution of adhesive and adherend should be measured correctly. In this paper, strain distribution of the bonded T joint manufactured by glass/epoxy composite material was measured on a real time using the distributed optical fiber sensor. An optical fiber was attached on a 41 cm section of a T joint. Spatial resolution of the distributed fiber sensor based on the BOCDA (Brillouin optical correlation domain analysis) method was 1.5 cm. 2 Experimental procedures 2.1 Operation principle and system The Brillouin frequency, the peak frequency of a Brillouin gain spectrum (BGS), depends on the strain and the temperature variation applied to the

  • ptical fiber. The shift of the Brillouin frequency

(

B

ν ∆ ) due to the temperature change ( T ∆ ) and an external axial strain ( ε ∆ ) for a bare optical fiber can be expressed as follows:

B T

C C T

ε

ν ε ∆ = ∆ + ∆ (1) where Cε is the Brillouin strain coefficient and

T

C is the Brillouin temperature coefficient [1,2]. The BOCDA is a method that generates Brillouin gain at a specified location along the optical fiber by modulating the frequency of pump wave and the counter-propagating probe wave [3]. Fig. 2 shows the schematic diagram and the configuration setup of the distributed fiber sensor system based on the BOCDA method.

DFB LD PD EOM (Electro-optic Modulator) Delay fiber EDFA SSBM (single-sideband modulator) 50/50 coupler BOCDA system Probe signal Pump signal Sensing fiber Lock-in amplifier VOA (variable optical attenuator) PSW EDFA (polarization switch) Circulator distributed feedback laser diode photo detector LD controller Current modulator Bias tee Microwave Generator Microwave Amp. Hybrid coupler Bias tee DC Voltage supplier EOM controller PSW controller Computer

(a) schematic diagram based on BOCDA method

AN EXPERIMENTAL STUDY ON STRAIN DISTRIBUTION OF BONDED JOINT UISNG OPTICAL FIBER SENSOR

Hyuk-Jin Yoon1*, Jung-Seok Kim1, Kwang-Yong Song2, Woo-Geun Lee1

1 Korea Railroad Research Institute, Ui-wang, 437-757 South Korea, 2 Department Of Physics, Chung-Ang University, Seoul, 156-756 South Korea

* Corresponding author (scipio@krri.re.kr)

Keywords: composite joint, optical fiber sensor, strain distribution, Brillouin scattering

slide-2
SLIDE 2

(b) configuration of the sensor system (c) LabView program for the real-time control of the sensor system Fig.2. Distributed optical fiber sensor system. The BGS was obtained by sweeping the frequency

  • f a microwave generator from 10.3 GHz to 11.3
  • GHz. By changing the LD modulation frequency, a

continuous distribution of the BGS along the sensing range of the optical fiber was acquired as a function

  • f the position. The Brillouin frequency was

determined by fitting the BGS with a Lorentzian curve, and its variation was converted into local strain by Eq. (1). The overall measurement process was controlled in real time by a computer algorithm coded with LabView. 2.2 Experimental setup Specimens were manufactured with 4-harness satin fabric glass/epoxy prepregs (GEP224, SK Chem., Korea). A hollow box and a square plate to fabricate T joint were bonded using the adhesive paste (EPIKOTETM MGS BPR 135G, Hexion, Germany). A single mode optical fiber (Samsung, Korea) with a diameter of 250 μm was attached on the surface of the composite T joint using Araldite epoxy (Huntsman, US) with a length of 41 cm. Fig.3. T joint specimen with a optical fiber attached

  • n the surface.

The sensing optical fiber was connected to the distributed fiber sensor system. As shown in Fig. 4, Both end points of the T joint were fixed on supporting jigs, and a vertical load actuator (MTS, US) was placed on a jig which was 62.5 cm apart from an end point of the T joint.

Distributed fiber sensor system Vertical load actuator T joint Optical fiber

Fig.4. Experimental setup to measure the strain distribution of the T joint.

slide-3
SLIDE 3

3 AN EXPERIMENTAL STUDY ON STRAIN DISTRIBUTION OF BONDED JOINT UISNG OPTICAL FIBER SENSOR

3 Results Vertical load acting on a steel beam caused the horizontal hollow box section of the T joint to bend and was increased at a rate of 0.5mm/min. The strain distribution of optical fiber was measured at every time the vertical displacement of the hollow box was increased 1mm as shown in Fig.5.

0.0 0.1 0.2 0.3 0.4

  • 500

500 1000 1500 2000

Strain (µε) Position(m) OFS at 0.2mm disp. OFS at 0.4mm disp. OFS at 0.6mm disp. OFS at 0.8mm disp. OFS at 1.0mm disp. concave adhesive fillet region Location of bolt at the vertical fixing jig

Fig.5. Strain distribution of T joint according to the vertical displacement. At the region between two bolts on a vertical fixing jig, compressive strain was arisen (0-0.11 m position at Fig. 5). At the position of 0.11 m, a bolt to fix the square plate to a jig was located and the strain was

  • zero. When the vertical displacement climbed up,

the strain at a position of the concave adhesive fillet was positively increased (square dotted area at Fig. 5). The strain was maximized at the center of the concave adhesive fillet. Out of the adhesive fillet the strain was decreased rapidly, because a steel beam was inserted into the hollow box. To the bolted location the horizontal steel beam with the hollow box, the strain was stable and varied proportional to the vertical displacement. Finally at the concave fillet region, crack was initiated and propagated through the side section as shown in Fig. 6. (a) initiated crack at the concave adhesive fillet (b) location of the propagated crack in progress of the experiment Fig.6. Crack propagation phenomenon of the T joint specimen. The data recording speed of the fiber optic sensor system was 5Hz at each point. The spatial resolution for this measurement was 1.5 cm with 42 measurement points with 1 cm step along the optical fiber. 4 Conclusion The strain distribution of the bonded T joint was measured using the attached optical fiber and the distributed fiber sensor system based on BOCDA

  • method. The strain near the adhesive fillet was

changed sharply and had the maximum value at the

slide-4
SLIDE 4
  • corner. The full section of T joint was effectually

monitored. The measurement

  • f

the strain distribution in this experiment can be used to verify the joint design during the vertical load test and to detect the fracture at the corner. References

[1] R. Bernini, A. Minardo and L. Zeni “A reconstruction technique for stimulated Brillouin scattering fiber-optic sensors for simultaneous measurement of temperature and strain”. Proceedings

  • f IEEE 2002, Vol. 2002, No. 2, pp 1006-1011, 2002.

[2] X Bao, J. Dhliwayo, N. Heron, Dj. Webb, DA.

  • Jackson. “Experimental and theoretical studies on a

distributed temperature sensor based on Brillouin scattering”. Journal of lightwave technology, Vol. 13,

  • No. 7, pp 1340-1348, 1995.

[3] K. Hotate and T. Hasegawa “Measurement of Brillouin Gain Spectrum Distribution along an Optical Fiber Using a Correlation-Based Technique- Proposal, Experiment and Simulation-”. IEICE transactions on electronics, Vol. 83, No. 3, pp 405- 412, 2000.