SLIDE 1
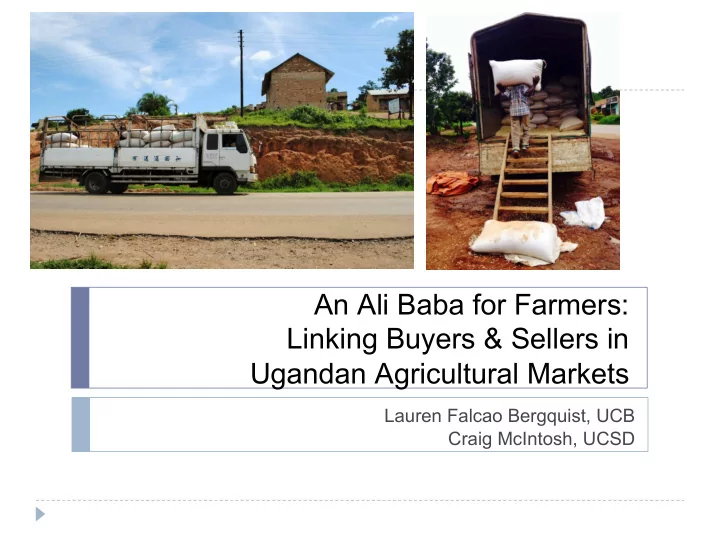
An Ali Baba for Farmers: Linking Buyers & Sellers in Ugandan Agricultural Markets
Lauren Falcao Bergquist, UCB Craig McIntosh, UCSD
SLIDE 2 Poor Integration in African Markets:
- Lack of market integration is a major issue.
- Imperfect co-integration over space (Rashid and Minot
2010)
- In Uganda, some improvement in major market integration
since market liberalization, but distant markets remain disconnected (Rashid 2004)
- Major implications for farmer income and food security
(e.g. Ethiopian famine of 1984)
- While poor roads and infrastructure often get much of
the blame, increasing attention paid to other transaction costs (Fafchamps 2004)
- Search costs
- Credit constraints
- Contractual risk
SLIDE 3 Barriers to Market Integration:
- Search costs:
- Reducing search costs dampens price dispersion (Jensen 2007, Aker
2010)
- Simply providing price information often insufficient to raise farmer income
(Aker & Fafchamps 2015, Fafchamps & Minten 2012)
- Necessary to fundamentally shift intermediary power/actors in order to
change prices (Goyal 2011, Svensson & Yanagizawa 2009)
- Credit & scale constraints
- Need to aggregate output of many small farmers
- Sellers themselves often lack the credit to do this aggregation.
- Contractual risk:
- Buyers must terms will be as promised when they arrive
- In the absence of contract enforcement, this leads to relational contracting
(Fafchamps and Minten, 1998; Gabre-Madhin, 2001)
SLIDE 4
How to make markets more efficient?
SLIDE 5 Our solution:
- Multipronged intervention providing:
- Creation of new private-sector intermediaries with direct links
to large buyers, including forward contracts for specific cash crops.
- Implementation of Kudu, new digital trading platform for
agricultural crops, allows farmers or agents to post lots
- Use of quality/bulking certification by agents and randomized
transport cost guarantees to promote digital platform.
- Creation of large-scale SMS-based Market Survey in 241
markets, collecting price data every two weeks.
- Creation of ‘SMS Blast’ system that broadcasts price data
from Kudu + Market Survey to traders and farmers in treatment markets.
- Large-scale RCT covering 12% of Uganda.
SLIDE 6 Our Team:
Evaluation Lab at
UCSD.
sector ag intermediary.
platform from Makerere
SLIDE 7 Research Design:
- Randomization conducted at sub-county level.
- Pick 2-3 largest trading centers in each sub-county; become
PSUs.
SLIDE 8
Our Team:
SLIDE 9 Study districts:
are:
remote
Agrinet to be attractive commercial candidates for expansion.
SLIDE 10
Study Trading Centers: Hubs and Spokes
SLIDE 11 Building Blocks of the Project (1):
- AgriNet
- Largest private-sector brokerage firm in Uganda
- 164 Commission Agents recruited by AgriNet
- CAs are existing agricultural traders in the
treatment communities
- given training on how to bulk and quality grade,
- how to use Kudu
- get additional contacts to buyers through AgriNet
- Randomized access to COB loans
- Randomized transport guarantees to buyers
SLIDE 12 Building Blocks of the Project (2):
- Kudu
- Designed by the College of Computing and
Informatics Technology at Makerere University.
- Registered sellers post lots for sale, state
reservation prices, system knows seller location.
- Buyers post bids and a ceiling price, matching
algorithm finds distance/price pareto frontier and displays 3 best lots to each seller (called “matches”).
- Price-setting mechanism gives buyer lowest
price possible.
SLIDE 13
Kudu interface – Buyer Requests
Buyer Bid Location specific Bid
SLIDE 14
Multi-Lingual Options – English, Luo, Luganda, Swahili
Luo Lugand a
SLIDE 15
Posting on Kudu by date
SLIDE 16
Kudu quantities:
SLIDE 17 Building Blocks of the Project (3): Market Survey System
- Recruit traders to serve as enumerators in 241
markets.
- Every two weeks they are pushed out a survey
and they respond by SMS.
- Open-source software being designed at
UCSD.
- Training, spot-checking conducted by IPA.
- New way of providing high-granularity market
data, system designed to be scaled rapidly within SSA if successful.
- Provides data capture for study as well as price
inputs for interventions in treatment markets.
SLIDE 18
Market Price Data
SLIDE 19 Building Blocks of the Project (4):
- SMS Blast System
- “Downstream” price information: price information
for your local market, your regional market, and Kampala or closest border market.
- “Random Blast” price information: each week we
randomly sample five treatment markets and circulate price information on these markets
- Extra AgriNet price information: prices for major
markets across the country collected by other firms (to which AN subscribes)
- Kudu marketing: advertising messages for Kudu
- Kudu price: recent prices of deals transacting on
Kudu
SLIDE 20
Market Linkages:
Basic Schematic: Farmers sell to traders in local market trading centers. Local traders sell on to regional middlemen who transport to large national, international markets.
SLIDE 21
Market Linkages:
Kudu: Provides direct linkage between farmers and national buyers. Our project trains & licences AgriNet CAs to certify the quality of lots posted in Kudu. AN to provide liquidity for bulking. Randomized guarantees of transport costs for buyers.
SLIDE 22
Market Linkages:
Market survey captures prices in T & C markets biweekly. Price data from Market Survey, Kudu fed into Blast SMS system. Farmers and Traders sign up to receive Blast SMS, system free for first two year of project.
SLIDE 23 Project Timeline:
- Trader and farmer baselines run Spring 2015
- Season 1: July-October 2015
- Season 2: Dec-March 2016
- Trader midline survey May-June 2016
- Season 3: July-October 2016
- Season 4: Dec-March 2017
- Endline surveys Spring 2017
- Move to scale project, including widespread radio
advertising, linking Kudu to other implementers
SLIDE 24
Cumulative sales
SLIDE 25
Initial signs of price convergence
SLIDE 26
Challenges: Price Mismatch
SLIDE 27 Addressing Price Mismatch:
- Adjustments to test:
- Moving Kudu to a USSD platform that allows for more
interactive relationship with customers as they post data.
- Price discovery:
- Clear the market daily.
- Identify sellers and buyers who do not match
- Send them an SMS letting them know the price they would have
had to post at (given location, crop, and quantity) to have matched.
SLIDE 28
Challenges: Quantity Mismatch
SLIDE 29 Addressing Quantity Mismatch
- ‘E-Bulking’
- Conduct intensive promotion of Kudu in treatment
villages, generate high density of asks in small area.
- Use Kudu as a way of organizing and bulking large
number of farmers:
- Data visualization tools to represent best opportunities to
E-bulk.
- Use AgriNet Commission Agents as entities to conduct
bulking on the ground.
- Connect E-bulking opportunities with COB credit for CAs
- Get farmers better prices, more reliable buyers.
SLIDE 30 Conclusion:
- Multipronged intervention that seeks to use ICT to:
- Reduce search costs
- Ease credit constraints and facilitate bulking
- Reduce contractual risk
- Preliminary results:
- SMS information systems worked well in season 1. Kudu
achieved lift-off in season 2.
- Initial evidence of price convergence.
- Season 3 goals:
- Data visualizations to allow traders to identify ‘buy’ and ‘sell’
regions.
- Improve price discovery using SMS Blast, Kudu notifications for
unmatched buyers & sellers
- Explore E-bulking, both on the ground (village-level promotion)
and as an algorithmic problem.
SLIDE 31
Weebale Nyo!