SLIDE 1
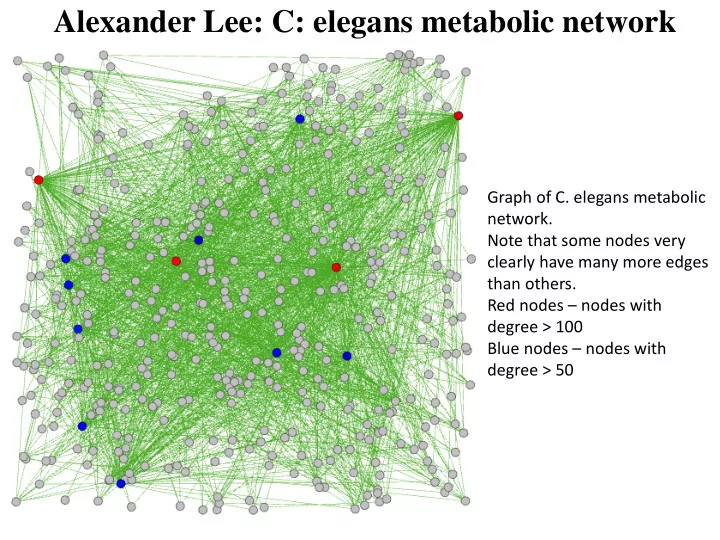
Graph of C. elegans metabolic network. Note that some nodes very clearly have many more edges than others. Red nodes – nodes with degree > 100 Blue nodes – nodes with degree > 50 Alexander Lee: C: elegans metabolic network
SLIDE 2
Graph of the corresponding scale-free network , by definition of BA there are no nodes with degree < 5. Blue nodes – nodes with degree = 5 (28.3% vs. 50% in the real-world network, Graph of the corresponding random network. Red nodes – nodes with degree within one standard deviation of average degree Graph of UC Irvine communication network. Blue nodes – nodes with degree <= 5. These nodes account for 50.0% of the network. Alexander Lee: UC Irvine communication network
SLIDE 3
Visualization of
Alex Meandzija: Biblical Proper Noun Network
Visualization of
SLIDE 4
Network of similarity of publications in "Senior Scholars‘ Basket of Journals" (the top 8 IS journals) from 2005 to 2014
Bradley Mason: Article Network, use of log log scale
SLIDE 5
Bradley Mason: article network, using betweenness centrality
The network to the left is colored by modularity class and the node size is proportional to that node's betweenness centrality measure. Scaling by betweenness centrality allows us to see which articles link to many different modularity classes and reveals which articles provide work that connects and unifies different areas.
SLIDE 6 The network is colored according to modularity class with node size proportional to closeness
- centrality. Coloring by modularity allows us to see the different political groups.
Because closeness measures how central a node is in the network, the large nodes in the above network correspond to blogs that pull information from a wide range of other blogs. The blogs have links to more parts of the network and are therefore presumably less partisan.
Bradley Mason: article network, using closeness centrality
SLIDE 7
Manqing Ma: network science and Ph.D. networks
Similarity revealed by proper visualization
SLIDE 8
Varun Rao & Austin Egri: Obama retweet network
Notice similarity to bio-networks
SLIDE 9
Kousuke Tachida: Network of fly (D. melanogaster) high-throughput protein-protein interactions
EPA Web Network shows the connectivity of websites that link to www.epa.gov. Note log log scales and estimation of slope of the drop which defined gamma
SLIDE 10
Kousuke Tachida: network of fly (D. melanogaster) high-throughput Protein-Protein Interactions (PPI)
SLIDE 11
Kousuke Tachida: network science coauthorship network
SLIDE 12 Tyler Shepherd: Political Blogs Network
This network represents hyperlinks between Internet blogs on U.S.
- politics. Nodes represent different
blogs and edges represent hyperlinks from oneblog to another. Edges are directed and unweighted. Each node has a value attribute indicating political leaning: 0 for liberal, 1 for conservative. This political leaning data comes from self-reported blog directories. Hyperlinks were found using a web crawler on the homepage of each
- blog. Data was collected and labeled
around the time of the 2004 political election.
SLIDE 13
Tyler Shepherd: General Relativity and Quantum Cosmology Collaboration Network
SLIDE 14
James Flamino, using network visualization
Network visualizations of the BA equivalent Usair (left) vs. the original Usair (right)
SLIDE 15
Logan Garber: Maayan FAA network
Comparing real-network with its BA model
SLIDE 16
Logan Garber: Rome road network
Comparing real-network with its BA (right upper corner) and ER (right lower corner) models
SLIDE 17
Christopher Jones: Yeast network
Similarity and differences between real-network and its BA model
SLIDE 18
Christopher Jones: Air Traffic Control network
The differences between real-network embedded in space and its BA model
SLIDE 19
Rosemonde Ausseil: Euro road network
The Euro road network represents the international E-road network, in which the nodes are cities and the edges are roads. There is a central hub that has the highest degree and one of the lowest eccentricities but low (0) clustering coefficient. The more moderate hubs are all clustered together, away from the main hub. This means that there are many roads that go from the biggest city to the smaller cities. Yet, the medium-sized cities are more inter- connected.
SLIDE 20
Rosemonde Ausseil: two bio networks
Bio grid mouse Graphic Representation Lung Network Graphic Representation The bio grid mouse network represents the protein-protein interactions in a mouse. Each node is a protein and an edge shows an interactions between them. All the hubs are clustered together The Lung represents the coupled temperature and water vapor transport in a lung; there are no “important nodes” in the network, nodes are equivalent in terms of degree and eccentricity.
SLIDE 21
Angelina Martineau: Communication network
This network describes the email communication between members of the University Rovira I Virgili in Tarragona in the south of Catalonia, Spain. Nodes with a higher degree are colored blue and are larger. Nodes with lower degrees are red and smaller.