Alder som kvantitativ 1 The LOGISTIC - - PDF document

alder som kvantitativ 1 the logistic procedure model
SMART_READER_LITE
LIVE PREVIEW

Alder som kvantitativ 1 The LOGISTIC - - PDF document

data framing; infile 'http://staff.pubhealth.ku.dk/~sr/MPH/datasets/framing.txt' URL firstobs= 2 ; input id sex age frw sbp sbp10 dbp chol cig chd yrschd death yrsdth cause; if chd= 1 then chd01= . ; if chd= 0 then chd01= 0 ; if chd > 1 then


slide-1
SLIDE 1

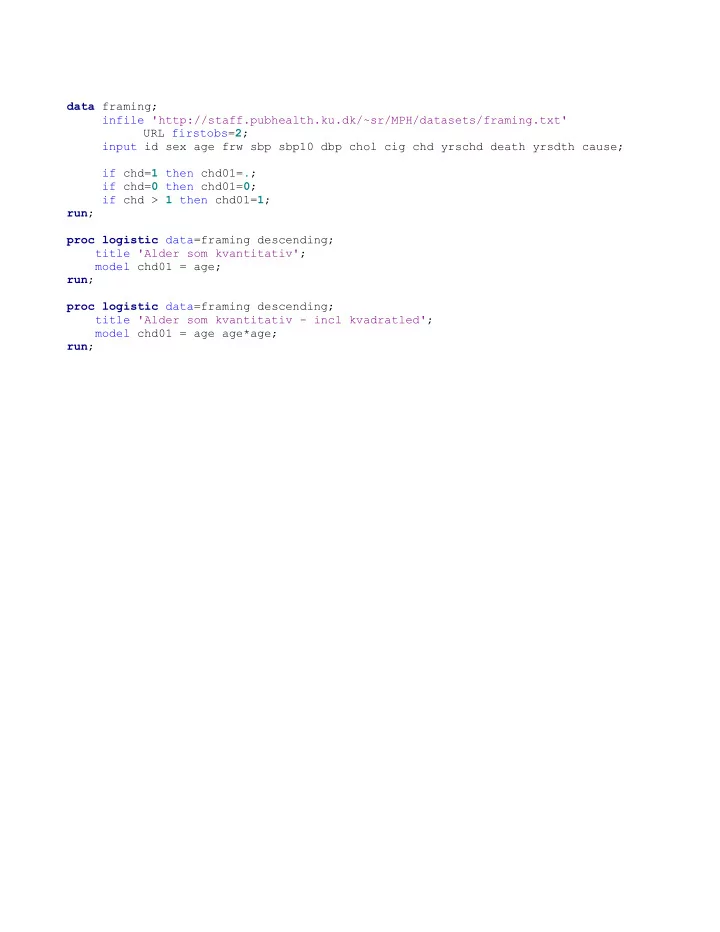
data framing; infile 'http://staff.pubhealth.ku.dk/~sr/MPH/datasets/framing.txt' URL firstobs=2; input id sex age frw sbp sbp10 dbp chol cig chd yrschd death yrsdth cause; if chd=1 then chd01=.; if chd=0 then chd01=0; if chd > 1 then chd01=1; run; proc logistic data=framing descending; title 'Alder som kvantitativ'; model chd01 = age; run; proc logistic data=framing descending; title 'Alder som kvantitativ - incl kvadratled'; model chd01 = age age*age; run;

slide-2
SLIDE 2

Alder som kvantitativ 1 The LOGISTIC Procedure Model Information Data Set WORK.FRAMING Response Variable chd01 Number of Response Levels 2 Model binary logit Optimization Technique Fisher's scoring Number of Observations Read 1406 Number of Observations Used 1363 Response Profile Ordered Total Value chd01 Frequency 1 1 268 2 0 1095 Probability modeled is chd01=1. NOTE: 43 observations were deleted due to missing values for the response

  • r explanatory variables.

Model Convergence Status Convergence criterion (GCONV=1E-8) satisfied. Model Fit Statistics Intercept Intercept and Criterion Only Covariates AIC 1353.246 1334.165 SC 1358.463 1344.600

  • 2 Log L 1351.246 1330.165

Testing Global Null Hypothesis: BETA=0 Test Chi-Square DF Pr > ChiSq Likelihood Ratio 21.0810 1 <.0001 Score 21.0467 1 <.0001 Wald 20.6991 1 <.0001

slide-3
SLIDE 3

Alder som kvantitativ 2 The LOGISTIC Procedure Analysis of Maximum Likelihood Estimates Standard Wald Parameter DF Estimate Error Chi-Square Pr > ChiSq Intercept 1 -4.8843 0.7737 39.8507 <.0001 age 1 0.0658 0.0145 20.6991 <.0001 Odds Ratio Estimates Point 95% Wald Effect Estimate Confidence Limits age 1.068 1.038 1.099 Association of Predicted Probabilities and Observed Responses Percent Concordant 56.2 Somers' D 0.181 Percent Discordant 38.1 Gamma 0.192 Percent Tied 5.7 Tau-a 0.057 Pairs 293460 c 0.590

slide-4
SLIDE 4

Alder som kvantitativ - incl kvadratled 3 The LOGISTIC Procedure Model Information Data Set WORK.FRAMING Response Variable chd01 Number of Response Levels 2 Model binary logit Optimization Technique Fisher's scoring Number of Observations Read 1406 Number of Observations Used 1363 Response Profile Ordered Total Value chd01 Frequency 1 1 268 2 0 1095 Probability modeled is chd01=1. NOTE: 43 observations were deleted due to missing values for the response

  • r explanatory variables.

Model Convergence Status Convergence criterion (GCONV=1E-8) satisfied. Model Fit Statistics Intercept Intercept and Criterion Only Covariates AIC 1353.246 1336.164 SC 1358.463 1351.816

  • 2 Log L 1351.246 1330.164

Testing Global Null Hypothesis: BETA=0 Test Chi-Square DF Pr > ChiSq Likelihood Ratio 21.0815 2 <.0001 Score 21.2273 2 <.0001 Wald 20.7181 2 <.0001

slide-5
SLIDE 5

Alder som kvantitativ - incl kvadratled 4 The LOGISTIC Procedure Analysis of Maximum Likelihood Estimates Standard Wald Parameter DF Estimate Error Chi-Square Pr > ChiSq Intercept 1 -4.6723 9.0295 0.2677 0.6048 age 1 0.0577 0.3424 0.0284 0.8661 age*age 1 0.000076 0.00323 0.0006 0.9812 Association of Predicted Probabilities and Observed Responses Percent Concordant 56.2 Somers' D 0.181 Percent Discordant 38.1 Gamma 0.192 Percent Tied 5.7 Tau-a 0.057 Pairs 293460 c 0.590