
SLIDE 1
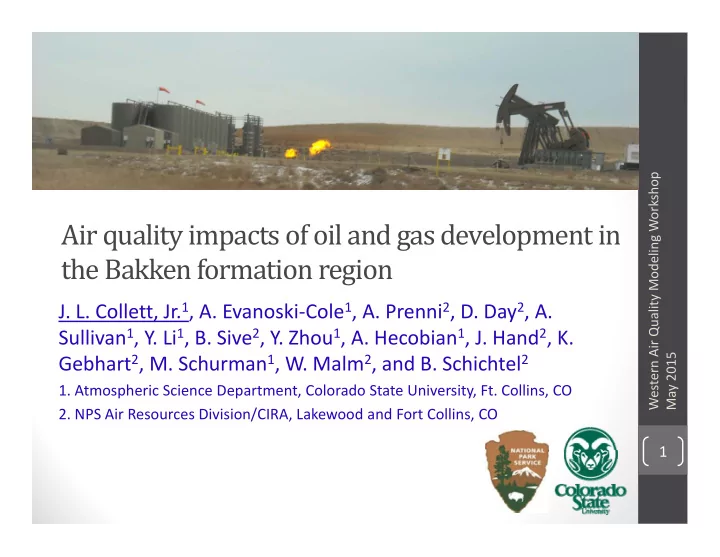
Air quality impacts of oil and gas development in the Bakken formation region
- J. L. Collett, Jr.1, A. Evanoski‐Cole1, A. Prenni2, D. Day2, A.
Sullivan1, Y. Li1, B. Sive2, Y. Zhou1, A. Hecobian1, J. Hand2, K. Gebhart2, M. Schurman1, W. Malm2, and B. Schichtel2
- 1. Atmospheric Science Department, Colorado State University, Ft. Collins, CO
- 2. NPS Air Resources Division/CIRA, Lakewood and Fort Collins, CO
Western Air Quality Modeling Workshop May 2015
1