
A SImplifying Framework for an Introductory Statistics Class 18 Nov 2013 2013‐Eakin‐DSI‐MSMESB‐Slides.pdf 1 A Simplifying Framework for an Introductory Statistics Class
By
- Dr. Mark Eakin
eakin@uta.edu University of Texas at Arlington
Advance Organizer
- Instructional strategy to promote learning and
retention or material used before instruction to help organize material that will be
- presented. Few if any technical terms used.
http://advanceorganizers.wikispaces.com/All+About+Advance+Organizers
- Have been shown to work in many but not all
studies (Meta‐analysis article by C.L. Stone, 1960)
http://www.jstor.org/stable/20151510
Random Rectangles
A set of 100 rectangles are displayed on one sheet of paper with the sizes of these rectangles being highly right‐skewed (see handout). Students are asked to sample from these to illustrate sampling distributions
- Created by Dr. Richard Scheaffer and found in his
book: Activity Based Statistics
- Numerous books now use versions of this
http://www.gobookee.org/statistics‐rectangle‐activity/
Sampling Activity
Four Approaches to Estimate Average Size of All 100 Boxes
- A guess of the average size of the rectangles
- Students asked to randomly pick rectangles
- Students close their eyes and randomly point to an ID in
a 10x10 table of rectangle ID numbers (Students did not know that I put all the large boxes IDs in the middle of the table.)
- Using their birth month and day students pick 10
(pseudo) random ID numbers from a table Their four estimate are collected using Blackboard.
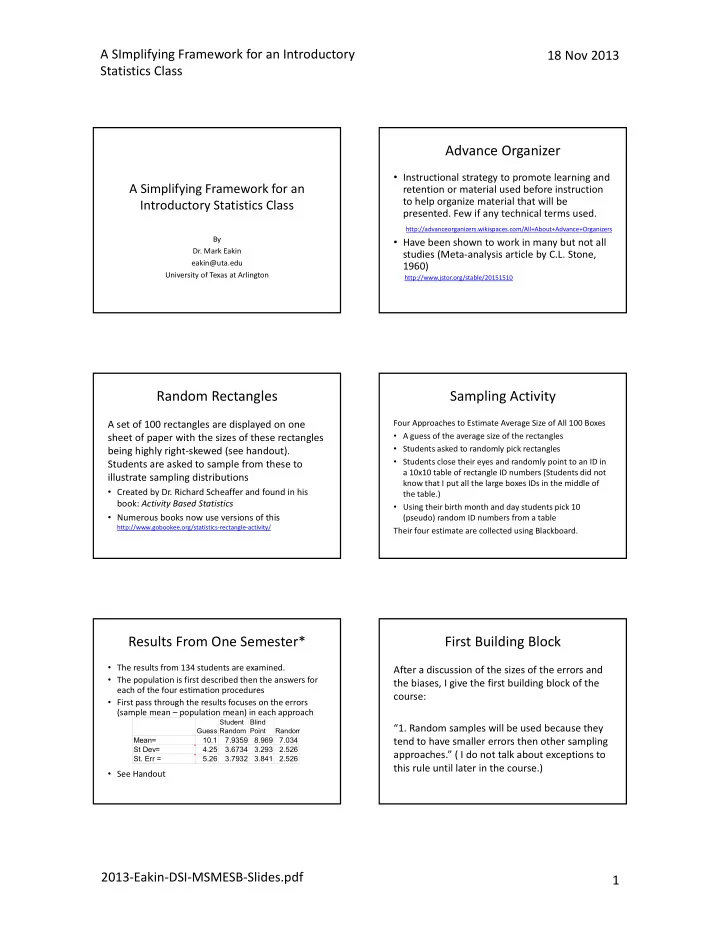
Results From One Semester*
- The results from 134 students are examined.
- The population is first described then the answers for
each of the four estimation procedures
- First pass through the results focuses on the errors
(sample mean – population mean) in each approach
- See Handout
Guess Student Random Blind Point Random Mean= 10.1 7.9359 8.969 7.034 St Dev= 4.25 3.6734 3.293 2.526
- St. Err =
5.26 3.7932 3.841 2.526
First Building Block
After a discussion of the sizes of the errors and the biases, I give the first building block of the course: “1. Random samples will be used because they tend to have smaller errors then other sampling approaches.” ( I do not talk about exceptions to this rule until later in the course.)