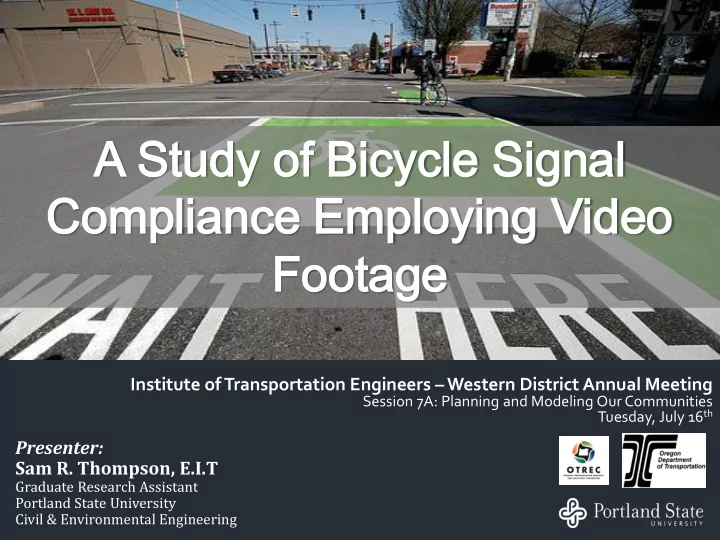

A St Study udy of of Bi Bicy cycle cle Si Signa gnal l Com ompl plian ance ce Emp mploy oying ing Vide deo o Foota Foo tage ge Institute of Transportation Engineers – Western District Annual Meeting Session 7A: Planning and Modeling Our Communities Tuesday, July 16 th Presenter: Sam R. Thompson, E.I.T Graduate Research Assistant Portland State University Civil & Environmental Engineering
Data Collection Two data sources: City of Portland Archived from previous research 3 intersections Portland City of Portland Footage Bicycle-specific Signals Portland State Project-specific 4 intersections Varying intersection characteristics/locations PSU Camera Setup PSU Study-Specific Footage Introduction Methodology Results Discussion Conclusions Acknowledgements 2
Data Reduction Cyclists were eligible to become part of the study if they were observed to: Arrive on the red indication Utilize bicycle infrastructure (and bicycle signal where applicable) on both sides of the intersection Introduction Methodology Results Discussion Conclusions Acknowledgements 3
Data Reduction Three types of data collected: Helmet: Yes Descriptive Car in Adjacent Lane: Yes Clothing Event Type: Casual Compliance- specific Sex: Male Cargo: Yes Introduction Methodology Results Discussion Conclusions Acknowledgements 4
Compliance Indicators Compliant Non-compliant Illegal right turn on red (RTOR) 1. Gap Accepted 2. Signal Jump 3. Introduction Methodology Results Discussion Conclusions Acknowledgements 5
Compliance Indicators Illegal Right Turn on Red: RTOR Introduction Methodology Results Discussion Conclusions Acknowledgements 6
Compliance Indicators Gap Accepted Introduction Methodology Results Discussion Conclusions Acknowledgements 7
Compliance Indicators Signal Jump Introduction Methodology Results Discussion Conclusions Acknowledgements 8
Results Total of 2,617 cyclists Initial Compliance Rate of 69.1% Compliance Rate excluding RTOR: 89.7% Compliance Indicator Percent Number of Observations Compliant 89.7 1809 Gap Accepted 5.9 118 Signal Jump 4.3 87 Other 0.1 3 Introduction Methodology Results Discussion Conclusions Acknowledgements 9
Compliance at Bike-Specific Signals 100% Compliant 75% Gap Accepted Signal Jump 50% Other 25% 0% No Bike Signal Bike Signal Introduction Methodology Results Discussion Conclusions Acknowledgements 10
Compliance per Location 100% Compliant 75% Gap Accepted Signal Jump 50% Other 25% 0% Introduction Methodology Results Discussion Conclusions Acknowledgements 11
Compliance by Presence of Cargo 100% Compliant 75% Gap Accepted Signal Jump 50% Other 25% 0% No Cargo Some Cargo Introduction Methodology Results Discussion Conclusions Acknowledgements 12
Compliance by Helmet Use 100% Compliant 75% Gap Accepted Signal Jump 50% Other 25% 0% Helmet No Helmet Introduction Methodology Results Discussion Conclusions Acknowledgements 13
Compliance by Peak Period 100% Compliant 75% Gap Accepted Signal Jump 50% Other 25% 0% AM PM Off Peak Introduction Methodology Results Discussion Conclusions Acknowledgements 14
Compliance by Wait Time 100% Compliant 75% Gap Accepted Signal Jump 50% Other 25% 0% 0 20 40 60 Wait Time (sec) Introduction Methodology Results Discussion Conclusions Acknowledgements 15
Gap Accepted by Cross Traffic 4 Ratio of Accepted Gap to AASHTO BCT 3 2 1 0 0 500 1000 1500 Cross Traffic (veh/hr) Introduction Methodology Results Discussion Conclusions Acknowledgements 16
Comparison to Other Modes Motorists do not come to a complete stop before completing a right turn 56.9% of the time 1 . Cyclists in this study committed RTOR violations at a rate of 23%. The average non-compliance rate for pedestrians is 15.8% 2 . Cyclists in this study had combined violation rate for signal jumps and accepted gaps of 7.8% Motorists were found to run red indications at a rate of 1.3% 3 . Cyclists in this study accepted gaps at a rate of 4.5%. Introduction Methodology Results Discussion Conclusions Acknowledgements 17
Conclusions Compliance at bicycle-specific signals is comparable to compliance at traditional signals Observed compliance nearly 90% excluding RTOR Risk-taking profile for non-compliant cyclists More likely to not wear a helmet Not influenced by wait time Minimum gap accepted equal to or less than minimum crossing time (determined by AASHTO) for high volume intersections. Introduction Methodology Results Discussion Conclusions Acknowledgements 18
Acknowledgements Oregon DOT Research Project TAC TAC: Gary Obery (ODOT), Peter Koonce (PBOT), Scott Beaird (Kittelson, Inc.), Nick Fortey (FHWA), Mark Joerger (ODOT) OTREC and Oregon DOT Dr. Christopher Monsere, Dr. Miguel Figliozzi, Kirk Paulsen Introduction Methodology Results Discussion Conclusions Acknowledgements 19
Qu Ques esti tion ons? s? Sam Thompson s.r.thompson@pdx.edu Find interim report, TRB papers, and presentations at http://bit.ly/SxRrZd * Opening photo credit via itdp @ flickr 20
References for Discussion 1. Zeeger, C. V., & Cynecki, M. J. (1985). Determination of Motorist Violations and Pedestrian-related Countermeasures Related to Right-Turn-On-Red. Transportation Research Record: Journal of the Transportation Research Board, (1010), 16 – 28. 2. Virkler, M. R. (1998). Pedestrian Compliance Effects on Signal Delay. Transportation Research Record: Journal of the Transportation Research Board, (1636), 88 – 91. 3. Retting, R. A., Williams, A. F., Farmer, C. M., & Feldman, A. F. (1999). Evaluation of Red Light Camera Enforcement in Oxnard, California. Accident Prevention & Analysis, 31, 169 – 174. Introduction Methodology Results Discussion Conclusions Acknowledgements 21
Recommend
More recommend