SLIDE 1
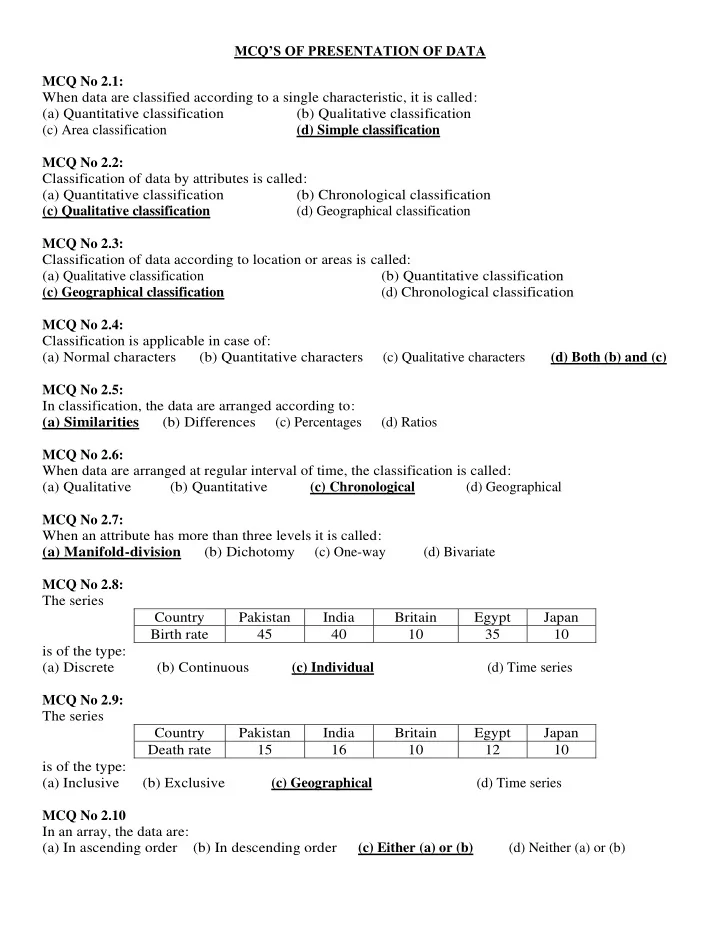
MCQ’S OF PRESENTATION OF DATA MCQ No 2.1: When data are classified according to a single characteristic, it is called: (a) Quantitative classification (b) Qualitative classification (c) Area classification (d) Simple classification MCQ No 2.2: Classification of data by attributes is called: (a) Quantitative classification (b) Chronological classification (c) Qualitative classification (d) Geographical classification MCQ No 2.3: Classification of data according to location or areas is called: (a) Qualitative classification (b) Quantitative classification (c) Geographical classification (d) Chronological classification MCQ No 2.4: Classification is applicable in case of: (a) Normal characters (b) Quantitative characters (c) Qualitative characters (d) Both (b) and (c) MCQ No 2.5: In classification, the data are arranged according to: (a) Similarities (b) Differences (c) Percentages (d) Ratios MCQ No 2.6: When data are arranged at regular interval of time, the classification is called: (a) Qualitative (b) Quantitative (c) Chronological (d) Geographical MCQ No 2.7: When an attribute has more than three levels it is called: (a) Manifold-division (b) Dichotomy (c) One-way (d) Bivariate MCQ No 2.8: The series Country Pakistan India Britain Egypt Japan Birth rate 45 40 10 35 10 is of the type: (a) Discrete (b) Continuous (c) Individual (d) Time series MCQ No 2.9: The series Country Pakistan India Britain Egypt Japan Death rate 15 16 10 12 10 is of the type: (a) Inclusive (b) Exclusive (c) Geographical (d) Time series MCQ No 2.10 In an array, the data are: (a) In ascending order (b) In descending order (c) Either (a) or (b) (d) Neither (a) or (b)
SLIDE 2
MCQ No 2.11 The number of tally sheet count for each value or a group is called: (a) Class limit (b) Class width (c) Class boundary (d) Frequency MCQ No 2.12 The frequency distribution according to individual variate values is called: (a) Discrete frequency distribution (b) Cumulative frequency distribution (c) Percentage frequency distribution (d) Continuous frequency distribution MCQ No 2.13 A series arranged according to each and every item is known as: (a) Discrete series (b) Continuous series (c) Individual series (d) Time series MCQ No 2.14 A frequency distribution can be: (a) Qualitative (b) Discrete (c) Continuous (d) Both (b) and (c) MCQ No 2.15 The following frequency distribution: X 5 15 38 47 68 f 2 4 9 3 1 Is classified (a) Relative frequency distribution (b) Continuous distribution (c) Percentage frequency distribution (d) Discrete distribution MCQ No 2.16 Frequency distribution is often constructed with the help of: (a) Entry table (b) Tally sheet (c) Both (a) and (b) (d) Neither (a) and (b) MCQ No 2.17 The data given as 3, 5, 15, 35, 70, 84, 96 will be called as: (a) Individual series (b) Discrete series (c) Continuous series (d) Time series MCQ No 2.18 Frequency of a variable is always in: (a) Fraction form (b) Percentage form (c) Less than form (d) Integer form MCQ No 2.19
Data arranged in ascending or descending order of magnitude is called: (a) Ungrouped data (b) Grouped data (c) Discrete frequency distribution (d) Arrayed data
MCQ No 2.20
The grouped data are called: (a) Primary data (b) Secondary data (c) Raw data (d) Difficult to tell
MCQ No 2.21 A series of data with exclusive classes along with the corresponding frequencies is called: (a) Discrete frequency distribution (b) Continuous frequency distribution (c) Percentage frequency distribution (d) Cumulative frequency distribution
SLIDE 3 MCQ No 2.22 In an exclusive classification, the limits excluded are: (a) Upper limits (b) Lower limits (c) Both lower and upper limits (d) Either lower or upper limits MCQ No 2.23 The series Weights(pounds) 15----20 20----25 25----30 30----35 35----40
10 15 30 10 5 is categorized as: (a) Continuous series (b) Discrete series (c) Time series (d) Geometric series MCQ No 2.24 The series Year 2007 2008 2009 2010 2011 Profit (000 Rs.) 7 10 16 18 22 will be called as: (a) Time series (b) Discrete series (c) Continuous series (d) Individual series MCQ No 2.25: The suitable formula for computing the number of classes is: (a) 3.322 logN (b) 0.322 logN (c) 1+3.322 logN (d) 1- 3.322 logN MCQ No 2.26: The number of classes in a frequency distribution is obtained by dividing the range of variable by the: (a) Total frequency (b) Class interval (c) Mid-point (d) Relative frequency MCQ No 2.27: If the number of workers in a factory is 256, the number of classes will be: (a) 8 (b) 9 (c) 10 (d) 12 MCQ No 2.28: The largest and the smallest values of any given class of a frequency distribution are called: (a) Class Intervals (b) Class marks (c) Class boundaries (d) Class limits MCQ No 2.29 If there are no gaps between consecutive classes, the limits are called: (a) Class limits (b) Class boundaries (c) Class intervals (d) Class marks MCQ No 2.30 The extreme values used to describe the different classes in a frequency distribution are called: (a) Class intervals (b) Class boundaries (c) Class limits (d) Cumulative frequency MCQ No 2.31 If in a frequency table, either the lower limit of first class or the upper limit of last class is not a fixed number, then classes are called: (a) One-way classes (b) Two-way classes (c) Discrete classes (d) Open-end classes MCQ No 2.32 The class boundaries can be taken when the nature of variable is: (a) Discrete (b) Continuous (c) Both (a) and (b) (d) Qualitative
SLIDE 4 MCQ No 2.33 Class boundaries are also called: (a) Mathematical limits (b) Arithmetic limits (c) Geometric limits (d) Qualitative limits MCQ No 2.34 The average of lower and upper class limits is called: (a) Class boundary (b) Class frequency (c) Class mark (d) Class limit MCQ No 2.35 The lower and upper class limits are 20 and 30, the midpoints of the class is: (a) 20 (b) 25 (c) 30 (d) 50 MCQ No 2.36 A frequency distribution that contains a class with limits of "10 and under 20" would have a midpoint: (a) 10 (b) 14.9 (c) 15 (d) 20 MCQ No 2.37 If the number of workers in a factory is 128 and maximum and minimum hourly wages are 100 and 20
- respectively. For the frequency distribution of hourly wages, the class interval is:
(a) 8 (b) 9 (c) 10 (d) 80 MCQ No 2.38 Width of interval h is equal to: MCQ No 2.39 Length of interval is calculated as:
(a) The difference between upper limit and lower limit (b) The sum of upper limit and lower limit (c) Half of the difference between upper limit and lower limit (d) Half of the sum of upper limit and lower limit
MCQ No 2.40 The class marks are given below: 10,12,14,16,18. The first class of the distribution is: (a) 9----12 (b) 10.5----12.5 (c) 9----11 (d) 10----12 MCQ No 2.41 If the midpoints are 10, 15, 20, 25 and 30. The last class boundary of the distribution is: (a) 25----30 (b) 27.5----32.5 (c) 20----35 (d) 30----35 MCQ No 2.42 The number of classes depends upon: (a) Class marks (b) Frequency (c) Class interval (d) Class boundary MCQ No 2.43 The class interval is the difference between: (a) Two extreme values (b) Two successive frequencies (c) Two successive upper limits (d) Two largest values
SLIDE 5
MCQ No 2.44 When the classes are 40----44, 45----49, 50----54, ... the class interval is: (a) 4 (b) (c) 100 (d) 5 MCQ No 2.45:
A grouping of data into mutually exclusive classes showing the number of observations in each class is called: (a) Frequency polygon (b) Relative frequency (c) Frequency distribution (d) Cumulative frequency
MCQ No 2.46:
The following frequency distribution Classes Less than 2 Less than 4 Less than 6 Less than 8 Less than 10 Frequency 2 6 16 19 20 is classified as: (a) Inclusive classification (b) Exclusive classification (c) Discrete classification (d) Cross classification
MCQ No 2.47:
The following frequency distribution Classes 10----20 20----30 30----40 40----50 50----60 Frequency 2 4 6 4 2 is classified as: (a) Exclusive classification (b) Inclusive classification (c) Geographical classification (d) Two-way classification
MCQ No 2.48:
The following frequency distribution Classes 0----4 5----9 10----14 15----19 20----24 Frequency 2 3 7 5 3 is classified as: (a) Multiple classification (b) Qualitative classification (c) Inclusive classification (d) Exclusive classification
MCQ No 2.49:
The following frequency distribution Classes More than 4 More than 4 More than 6 More than 8 More than 10 Frequency 2 6 16 19 20 is classified as: (a) Geographical classification (b) Chronological classification (c) Inclusive classification (d) Exclusive classification
MCQ No 2.50:
The class frequency divided by the total number of observations is called: (a) Percentage frequency (b) Relative frequency (c) Cumulative frequency (d) Bivariate frequency
MCQ No 2.51:
The relative frequency multiplied by 100 is called: (a) Percentage frequency (b) Cumulative frequency (c) Bivariate frequecy (d) Simple frequency
SLIDE 6
MCQ No 2.52 In a relative frequency distribution, the total of the relative frequencies is: (a) 100 (b) One (c) ∑f (d) ∑ X MCQ No 2.53: In a percentage frequency distribution, the total of the percentage frequencies is always equal to: (a) 1 (b) ∑f (c) 100% (d) ∑X MCQ No 2.54 The cumulative frequency of first group in more than cumulative frequency distribution is always equal to: (a) 1 (b) 100 (c) ∑f (d) ∑X MCQ No 2.55 The cumulative frequency of last class in less than cumulative frequency distribution is always equal to: (a) ∑f (b) ∑X (c) 1 (d) 100 MCQ No 2.56:
The following frequency distribution: Classes Less than 10 Less than 20 Less than 30 Less than 40 Less than 50 Frequency 2 6 16 19 20 is classified as: (a) Less than cumulative frequency distribution (b) More than cumulative frequency distribution (c) Discrete frequency distribution (d) Cumulative percentage frequency distribution
MCQ No 2.57:
The following frequency distribution Classes 50----55 55----60 60----65 65----70 70----75 Frequency 40 36 30 16 4 is classified as: (a) Relative frequency distribution (b) Less than cumulative frequency distribution (c) More than cumulative frequency distribution (d) Bivariate frequency distribution
MCQ No 2.58 A frequency distribution formed considering two variables at a time is called: (a) Univariate frequency distribution (b) Bivariate frequency distribution (c) Trivariate frequency distribution (d) Bimodal distribution MCQ No 2.59 The sum of rows or sum of columns, of a bivariate, frequency distribution is equal to: (a) ∑X (b) ∑fX (c) ∑(f+X) (d) ∑f MCQ No 2.60:
The arrangement of data in rows and columns is called: (a) Classification (b) Tabulation (c) Frequency distribution (d) Cumulative frequency distribution
MCQ No 2.61:
When the qualitative or quantitative raw data are classified according to one characteristic, the tabulation of different groups is called: (a) Dichotomy (b) Manifold-division (c) Bivariate (d) One-way
SLIDE 7
MCQ No 2.62 A statistical table consists of at least: (a) Two parts (b) Three parts (c) Four parts (d) Five parts MCQ No 2.63 In a statistical table, prefatory note is shown: (a) Below the body (b) Box head ` (c) Foot note (d) Below the title MCQ No 2.64 A source note in a statistical table is given: (a) At the end of a table (b) In the beginning of a table (c) In the middle of a table (d) Below the body of a table MCQ No 2.65 In a statistical table, column captions are called: (a) Box head (b) Stub (c) Body (d) Title MCQ No 2.66
In a statistical table, row captions are called:
(a) Box head (b) Stub (c) Body (d) Title MCQ No 2.67:
The headings of the rows of a table are called: (a) Prefatory notes (b) Titles (c) Stubs (d) Captions
MCQ No 2.68:
The headings of the columns of a table are called: (a) Stubs (b) Captions (c) Footnotes (d) Source notes
MCQ No 2.69:
The budgets of two families can be compared by: (a) Sub-divided rectangles (b) Pie diagram (c) Both (a) and (b) (d) Histogram
MCQ No 2.70:
Total angle of the pie-chart is: (a) 45 (b) 90 (c) 180 (d) 360
MCQ No 2.71:
Diagram are another form of: (a) Classification (b) Tabulation (c) Angle (d) Percentage
MCQ No 2.72 In pie diagram, the angle of a sub-sector is obtained as: MCQ No 2.73:
A pie diagram is represented by a: (a) Rectangle (b) Circle (c) Triangle (d) Square
SLIDE 8
MCQ No 2.74:
A sector diagram is also called: (a) Bar diagram (b) Histogram (c) Historigram (d) Pie diagram
MCQ No 2.75:
Which of the following is not a one-dimensional diagram: (a) Simple bar diagram (b) Multiple bar diagram (c) Component bar diagram (d) Pie diagram
MCQ No 2.76:
Which of the following is a two-dimensional diagram: (a) Sub-divided bar (b) Percentage component bar chart (c) Sub-divided rectangles (d) Multiple bar diagram
MCQ No 2.77:
Pie diagram represents the components of a factor by: (a) Circles (b) Sectors (c) Angles (d) Percentages
MCQ No 2.78:
The suitable diagram to represent the data relating to the monthly expenditure on different items by a family is: (a) Historigram (b) Histogram (c) Multiple bar diagram (d) Pie diagram
MCQ No 2.79
A graph of time series or historical series is called: (a) Histogram (b) Historigram (c) Frequency curve (d) Frequency polygon
MCQ No 2.80 The historigram is the graphical presentation of data which are classified: (a) Geographically (b) Numerically (c) Qualitatively (d) According to time MCQ No 2.81 Historigram and histogram are: (a) Always same (b) Not same (c) Off and on same (d) Randomly same MCQ No 2.82 A distribution in which the observations are concentrated at one end of the distribution is called a:
(a) Symmetric distribution (b) Normal distribution (c) Skewed distribution (d) Uniform distribution
MCQ No 2.83 For graphic presentation of a frequency distribution, the paper to be used is: (a) Carbon paper (b) Ordinary paper (c) Graph paper (d) Butter paper MCQ No 2.84 Histogram can be drawn only for: (a) Discrete frequency distribution (b) Continuous frequency distribution (c) Cumulative frequency distribution (d) Relative frequency distribution MCQ No 2.85 Histogram is a graph of: (a) Frequency distribution (b) Time series (c) Qualitative data (d) Ogive
SLIDE 9
MCQ No 2.86 Histogram and frequency polygon are two graphical representations of: (a) Frequency distribution (b) Class boundaries (c) Class intervals (d) Class marks MCQ No 2.87 Frequency polygon can be drawn with the help of: (a) Historigram (b) Histogram (c) Circle (d) Percentage MCQ No 2.88 In a cumulative frequency polygon, the cumulative frequency of each class is plotted against: (a) Mid-point (b) Lower class boundary (c) Upper class boundary (d) Upper class limit MCQ No 2.89 The graph of the cumulative frequency distribution is called: (a) Histogram (b) Frequency polygon (c) Pictogram (d) Ogive MCQ No 2.90 When successive mid-points in a histogram are connected by straight lines, the graph is called a: (a) Historigram (b) Ogive (c) Frequency curve (d) Frequency polygon MCQ No 2.91 A frequency polygon is a closed figure which is: (a) One sided (b) Two sided (c) Three sided (d) Many sided MCQ No 2.92 Ogive curve can be occurred for the distribution of: (a) Less than type (b) More than type (c) Both (a) and (b) (d) Neither (a) and (b) MCQ No 2.93 The word ogive is also used for: (a) Frequency polygon (b) Cumulative frequency polygon (c) Frequency curve (d) Histogram MCQ No 2.94 Cumulative frequency polygon can be used for the calculation of: (a) Mean (b) Median (c) Mode (d) Geometric mean