
SLIDE 1
| 1 GMAC-2016 This document is uncontrolled
Place image here (13.33” x 3.5”)
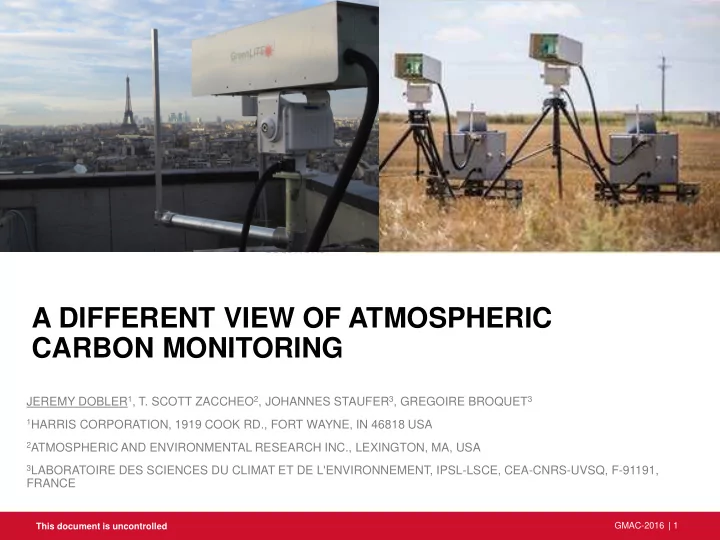
A DIFFERENT VIEW OF ATMOSPHERIC CARBON MONITORING
JEREMY DOBLER1, T. SCOTT ZACCHEO2, JOHANNES STAUFER3, GREGOIRE BROQUET3
1HARRIS CORPORATION, 1919 COOK RD., FORT WAYNE, IN 46818 USA 2ATMOSPHERIC AND ENVIRONMENTAL RESEARCH INC., LEXINGTON, MA, USA 3LABORATOIRE DES SCIENCES DU CLIMAT ET DE L'ENVIRONNEMENT, IPSL-LSCE, CEA-CNRS-UVSQ, F-91191,
FRANCE