
SLIDE 1
A CHANGING LOS ANGELES: LATINO COMMUNITIES AND OUR ECONOMIC FUTURE - - PDF document
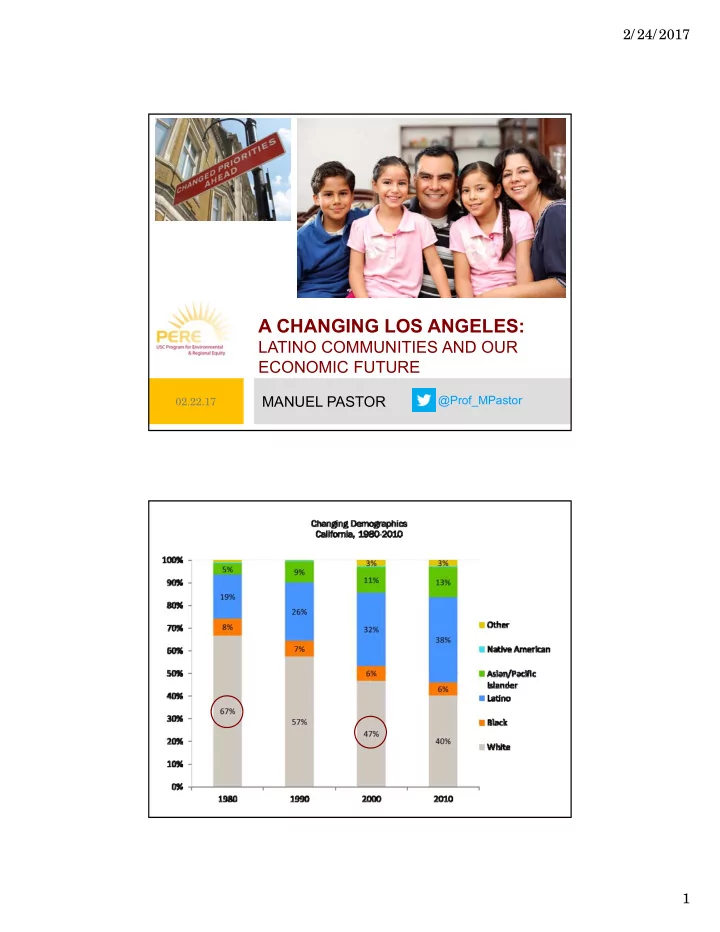
2/ 24/ 2017 A CHANGING LOS ANGELES: LATINO COMMUNITIES AND OUR ECONOMIC FUTURE MANUEL PASTOR @Prof_MPastor 02.22.17 1 2/ 24/ 2017 Changing Demographics, California, 19802040 100% 3% 3% 3% 3% 4% 6% 9% 11% 90% 13% Other 14%
67% 57% 47% 40% 37% 34% 30% 8% 7% 6% 6% 6% 5% 5% 19% 25% 32% 38% 40% 43% 45% 6% 9% 11% 13% 14% 14% 15% 3% 3% 3% 3% 4% 0% 10% 20% 30% 40% 50% 60% 70% 80% 90% 100% 1980 1990 2000 2010 2020 2030 2040 Changing Demographics, California, 1980‐2040 Other Native American Asian/Pacific Islander Latino Black White 53% 41% 31% 28% 25% 22% 20% 12% 11% 9% 8% 8% 8% 7% 28% 37% 45% 48% 51% 54% 56% 6% 10% 12% 14% 14% 14% 14% 3% 2% 2% 3% 3% 0% 10% 20% 30% 40% 50% 60% 70% 80% 90% 100% 1980 1990 2000 2010 2020 2030 2040 Changing Demographics Los Angeles County, 1980‐2040 Other Asian/Pacific Islander Latino Black White
0% 5% 10% 15% 20% 25% 30% 35% 40% 45% 1860 1870 1880 1890 1900 1910 1920 1930 1940 1950 1960 1970 1980 1990 2000 2010 2014
Los Angeles California U.S.
‐10% ‐23% ‐2% ‐29% 39% ‐3% 31% ‐6% 31% ‐8%
35 45 45 41 38 29 26
60% 70% 80% 82% Non-Hispanic White African American Latino Asian Pacific Islander
5,930,372 4,087,626 10,072,681 3,113,819 4,375,038 3,379,311 7,408,103 38,366,950
0% 5% 10% 15% 20% 25% 30% 35% 40%
Rest of California Central Valley Los Angeles Orange Inland Empire Border Bay Area Total
316,425 339,649 962,150 254,735 266,149 204,703 506,677
0% 5% 10% 15% 20% 25% 30% 35% 40%
Rest of California Central Valley Los Angeles Orange Inland Empire Border Bay Area
So urc e : U S Ce nsus
Mississippi Arkansas Louisiana D.C. Alabama Florida Oklahoma Tennessee Kentucky South Dakota New Mexico Texas Missouri West Virginia Georgia South Carolina Virginia North Carolina North Dakota Kansas New York Nebraska Arizona Iowa Montana California Minnesota Rhode Island Alaska Colorado Idaho Oregon Illinois Wyoming Maryland Massachusetts Delaware New Jersey Pennsylvania Hawaii Vermont Connecticut Washington Ohio Wisconsin Nevada Maine Michigan Utah Indiana New Hampshire
Household* Gini Coefficient, 1969
District of Columbia New York Connecticut Louisiana California Massachusetts Florida Rhode Island Texas Tennessee Georgia New Mexico Illinois Mississippi Alabama New Jersey North Carolina Arkansas Kentucky South Carolina Pennsylvania Arizona North Dakota Oklahoma Virginia Ohio Missouri Oregon Michigan Kansas Maine Colorado West Virginia Montana Washington Idaho Minnesota Delaware Maryland South Dakota Indiana Iowa Nevada New Hampshire Vermont Wisconsin Nebraska Hawaii Utah Wyoming Alaska
So urc e : U S Ce nsus
Ho useho ld Gini Co effic ient , 2014
So urc e : I PU MS
‐25% ‐23% ‐11% 4% 13% ‐11% ‐10% ‐7% 6% 17%
10th Percentile 20th Percentile 50th Percentile 80th Percentile 90th Percentile
Income Percentiles, Earned Income for Full‐Time Workers 25‐64 ($2010) U.S. and Los Angeles County, 1980‐2010*
Los Angeles County United States
8% 29% 36% 18% 20% 11% 30% 38% 18% 26%
White Black Latino Asian/Pacific Islander All Percent of Families Living Below 150 Percent of the Federal Poverty Line by Race/Ethnicity Los Angeles County 1990 2010‐2014
1% 3% 11% 3% 5% 2% 4% 13% 4% 7%
White Black Latino Asian/Pacific Islander All Percent of Full‐Time Workers age 25‐64 Below 150 Percent of the Federal Poverty Line by Race/Ethnicity Los Angeles County 1990 2010‐2014
35% 5% 10% 41% 11% 18% 36% 19% 25% 25% 14% 21% 4% 25% 31% 18% 16% 22% 5% 9% 10% 5% 8% 8% 21% 41% 22% 11% 51% 31%
0% 5% 10% 15% 20% 25% 30% <$15,000 $15,000‐$35,000 $35,000‐$65,000 >$65,000
Percent Using Public Transit by Race/Ethnicity Los Angeles County, 2010‐2014
White Black Latino Asian/Pacific Islander Other
59% 54% 54% 55% 63% 65%
40% 45% 50% 55% 60% 65% 70% All Asian/Pacific Islander White Other Latino Black
Percent Rent Burdened by Race/Ethnicity Los Angeles County, 2010‐2014
16% 8% 5% 7% 11% 25% 13% 14% 13% 19% 0% 5% 10% 15% 20% 25% 30% Non‐Hispanic White Black Latino API Other % Self‐employed among employed population ages 16+
Native Born Immigrant
Source: 2012 Survey of Business Owners.
29.6% 10.6% 8.6% 5.7% 6.4% 0% 5% 10% 15% 20% 25% 30% 35% Share of all firms Share of firms w/ employees Share of employees Share of receipts Share of payroll
Source: CSII analysis of data from the U.S. Census Bureau and the UC Berkeley Statewide Database .
23% 23% 32% 32% 35% 35% 44 44% 48% 48% Voted, 2014 General Election Registered to Vote, 2014 General Election Citizen Voting Age Population, 2009 to 2013 Voting Age Population, 2009 to 2013 Total Population, 2009 to 2013
LA County