SLIDE 1
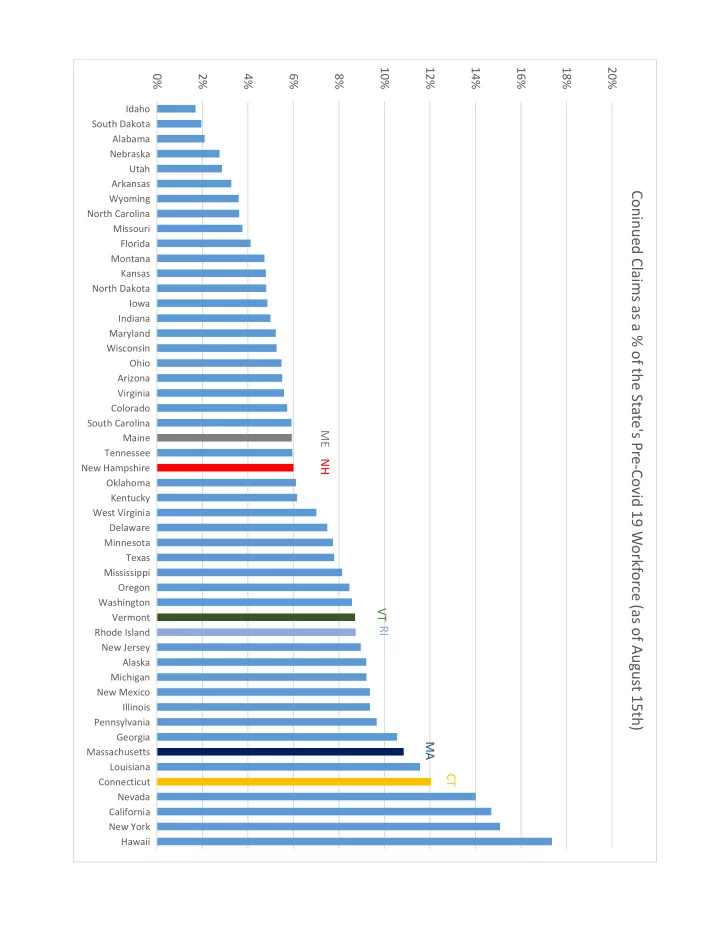
0% 2% 4% 6% 8% 10% 12% 14% 16% 18% 20%
Idaho South Dakota Alabama Nebraska Utah Arkansas Wyoming North Carolina Missouri Florida Montana Kansas North Dakota Iowa Indiana Maryland Wisconsin Ohio Arizona Virginia Colorado South Carolina Maine Tennessee New Hampshire Oklahoma Kentucky West Virginia Delaware Minnesota Texas Mississippi Oregon Washington Vermont Rhode Island New Jersey Alaska Michigan New Mexico Illinois Pennsylvania Georgia Massachusetts Louisiana Connecticut Nevada California New York Hawaii
Coninued Claims as a % of the State's Pre-Covid 19 Workforce (as of August 15th)
NH ME VT RI MA CT
SLIDE 2
30 40 50 60 70 80 90 100 110 30 40 50 60 70 80 90 100 110
2-May 9-May 16-May 23-May 30-May 6-Jun 13-Jun 20-Jun 27-Jun 4-Jul 11-Jul 18-Jul 25-Jul 1-Aug 8-Aug 15-Aug
Continuing Unemployment Claims (Index: Each Region's Peak = 100)
SLIDE 3
42.3% 48.3% 67.7% 52.0% 54.4% 43.7% 63.9% 70.7% 81.2% 84.2% 69.9% 80.2% 38.6% 37.3% 19.5% 36.5% 34.3% 45.7% 27.2% 20.6% 11.2% 10.1% 24.7% 15.9%
0% 10% 20% 30% 40% 50% 60% 70% 80% 90% 100% 110% Accommodation Food Services & Drinking Places Administrative & Support Services Miscellaneous Store Retailers Amusement, Gambling, & Recr. Clothing Stores Motor Vehicle & Parts Dealers General Merchandise Stores Nursing & Residential Care Facilities Food & Beverage Stores Ambulatory Health Care Services Hospitals
Pandemic Impact on NH Employment and Recovery Since Easing (As of August 15th) Pandemic Emp. as a % of Pre-Covid-19 Emp. % Gained Since Easing
96.1% 94.6% 94.3% 92.3% 91.3% 91.1% 89.4% 88.7% 88.5% 87.2% 85.5% 80.8%
SLIDE 4
2 4 6 8 10 12 14 16 18 20 2 4 6 8 10 12 14 16 18
1 6 11 16 21 26 31 36 41 46
Axis Title
Insured Unemployment Rate
Weeks
It Took 26 Weeks for Unemployment to Peak During the "Great Recession," it Took Just 7 During the Pandemic Early 90s Recession "Great Recession" "Covid-19 Pandemic"
Peak