A 2010 Mapping of the Constructed Surface Area Density for S.E. Asia - - PowerPoint PPT Presentation

a 2010 mapping of the constructed surface area density
SMART_READER_LITE
LIVE PREVIEW

A 2010 Mapping of the Constructed Surface Area Density for S.E. Asia - - PowerPoint PPT Presentation

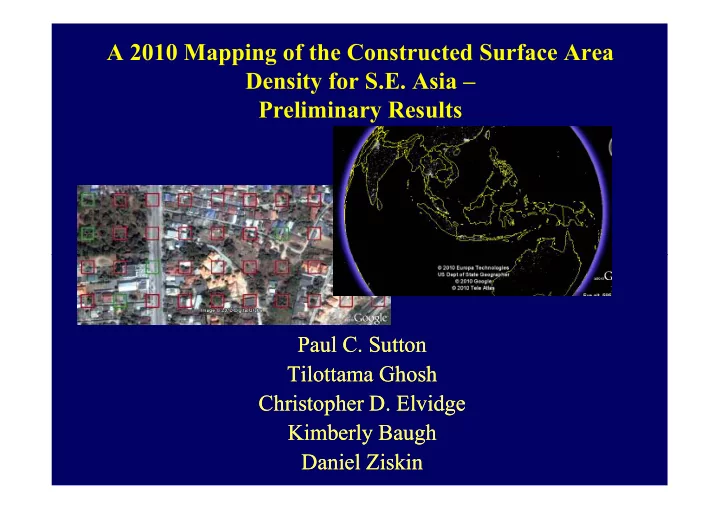
A 2010 Mapping of the Constructed Surface Area Density for S.E. Asia Preliminary Results Paul C. Sutton Paul C. Sutton Tilottama Ghosh Tilottama Ghosh Christopher D. Elvidge Christopher D. Elvidge Kimberly Baugh Kimberly Baugh Daniel


slide-1
SLIDE 1

A 2010 Mapping of the Constructed Surface Area Density for S.E. Asia – Preliminary Results

Paul C. Sutton Paul C. Sutton Tilottama Ghosh Tilottama Ghosh Christopher D. Elvidge Christopher D. Elvidge Kimberly Baugh Kimberly Baugh Daniel Daniel Ziskin Ziskin

slide-2
SLIDE 2

Outline

  • Motivation for Mapping Constructed Impervious Surfaces
  • Methods: Data Acquisition

– http://www.ngdc.noaa.gov/dmsp/imaps/isamapper/

  • Methods: Regression Analysis

– %ISA = B1*+ighttime Lights + B2* Population Density – %ISA = B1*+ighttime Lights + B2* Population Density

  • Results: Data Product . ISA of Southeast Asia at ~ 1km2
  • Discussion and Future Research
slide-3
SLIDE 3
  • Constructed Areas (aka ISA) have significant

environmental impacts

– ISA alters sensible and latent heat fluxes – causing urban heat islands – In naturally vegetated areas anthropogenic ISA reduces carbon sequestration – ISA alters the character of watersheds by increasing frequency and magnitude of surface runoff pulses – ISA can alter the shape of stream channels, raising water temperatures, and sweeping urban pollutants into aquatic environments – ISA causes reduced surface water quality, increased flooding, and reductions in rates of groundwater

!"##$% & ' ((!)%*+*,

  • ./01234!"##5%

"##55*$6"+*$5$

– ISA causes reduced surface water quality, increased flooding, and reductions in rates of groundwater recharge

  • Anthropogenic Impervious Surface can be mapped globally at

moderate spatial resolutions using satellite imagery

– Anthropogenic ISA is typically associated with developed areas. – The relationship between human settlement density and ISA fraction is regionally variable

  • Anthropogenic Impervious Surface is a significant and

universal proxy measure of human impact on the environment

slide-4
SLIDE 4

Methods: Data Acquisition

! !"#$%& !' ( $(( #)* )+, (

  • &77000'7777
slide-5
SLIDE 5

The Town of Nakhon Ratchasima, Thailand Population ~150,000

High Resolution Satellite Imagery from Google Earth is used to classify A sample of pixels from SE asia. DMSP OLS imagery overlaid as A KML file via the Google Earth Plug.in

slide-6
SLIDE 6

Image Classification with the Light Picker

In this preliminary study we have done this about 10,000 times to produce about 35 data points to build a regression model Once a point sample has been classified it turns green

slide-7
SLIDE 7

One pixel is a bit of work…

Our dependent variable: “% Constructed Area” is Determined by the fraction Of the 256 (16 x 16 red square point samples in each DMSP Pixel) That are classified as one of the following ‘Developed’ categories: ‘Street/Road’, ‘Flat Roof’, ‘Other Roof’ or ‘Other Constructed’

slide-8
SLIDE 8

Regression Model Development

  • We use a DMSP OLS nighttime lights dataset and the

Landscan Population dataset to predict % Constructed Area as follows:

  • % Cons. Area = β1*DMSP D+ value + β2 * Landscan
  • % Cons. Area = β1*DMSP D+ value + β2 * Landscan
  • This model will produce non.zero Constructed Area

percentages in areas with no light and in areas with no population.

slide-9
SLIDE 9

Radiance Calibrated image of 2010 (F16)

2''.1489:"#*#

+9'1+;8''0

30 arc;second grid or approximately 1 km2 at the equator

slide-10
SLIDE 10

2008 LandScan population grid

  • US Laboratory Department of Energy, Oak Ridge National

Laboratory

  • Representing ambient population count per cell
  • 30 arc;second grid or approximately 1 km2 at the equator
slide-11
SLIDE 11

Parameter Estimation

R2 = 0.87 α = 0.0 (forced) β1 = .182 β2 = .00063 β2 = .00063

slide-12
SLIDE 12

Constructed Area of South East Asia

slide-13
SLIDE 13

Estimated Constructed Area

  • f Hanoi and HCMC

Ho Chi Minh Hanoi

# *#+ *## <+ *# "+ < #*+ "

slide-14
SLIDE 14

Table of Results

Countries Population Total Area (km2) Total ISA (km2) %ISA GDP 2008 - (millions) US$ ISA (m2)/person GDP (millions)/ISA (km2) Brunei 318,930 5,804 114 1.97 19,559 359 171 Cambodia 14,282,900 182,857 117 0.06 28,408 8 242 East Timor 1,024,330 15,154 13 0.09 880 13 67 Indonesia 229,554,000 1,896,490 5,516 0.29 907,955 24 165 Laos 6,696,710 230,940 99 0.04 13,181 15 133 Malaysia 24,087,200 330,669 2,797 0.85 384,002 116 137 Myanmar (Burma) 46,965,100 670,705 392 0.06 ? 8 ? Papua New Guinea 5,424,430 466,753 98 0.02 14,337 18 146 Philippines 90,491,600 296,755 1,452 0.49 317,352 16 219 Singapore 4,314,760 552 314 56.89 238,685 73 760 Thailand 64,857,000 515,058 3,511 0.68 544,913 54 155 Vietnam 84,658,300 326,884 2,295 0.70 240,292 27 105 Source of GDP data - World Bank website

slide-15
SLIDE 15

Conclusion

Preliminary Results Only (+ ~30 pixels) We’d love to have

  • thers join us in the classification tasks on the ‘ISA Picker’ ☺

☺ ☺ ☺ Regionalization of Parameter Estimation improves accuracy of

  • estimation. Relative to prior studies in the U.S. it takes more

light and more people to predict the same percentage of pavement in SouthEast Asia. pavement in SouthEast Asia. Richer dataset not being exploited because of our simple classification into constructed vs. not.constructed. Future research will explore the relative frequency of various categories on a regional and/or national basis.