
SLIDE 1
Relative Density Chapters 3.5 Relative Density 1 2/5/2015 - - PDF document
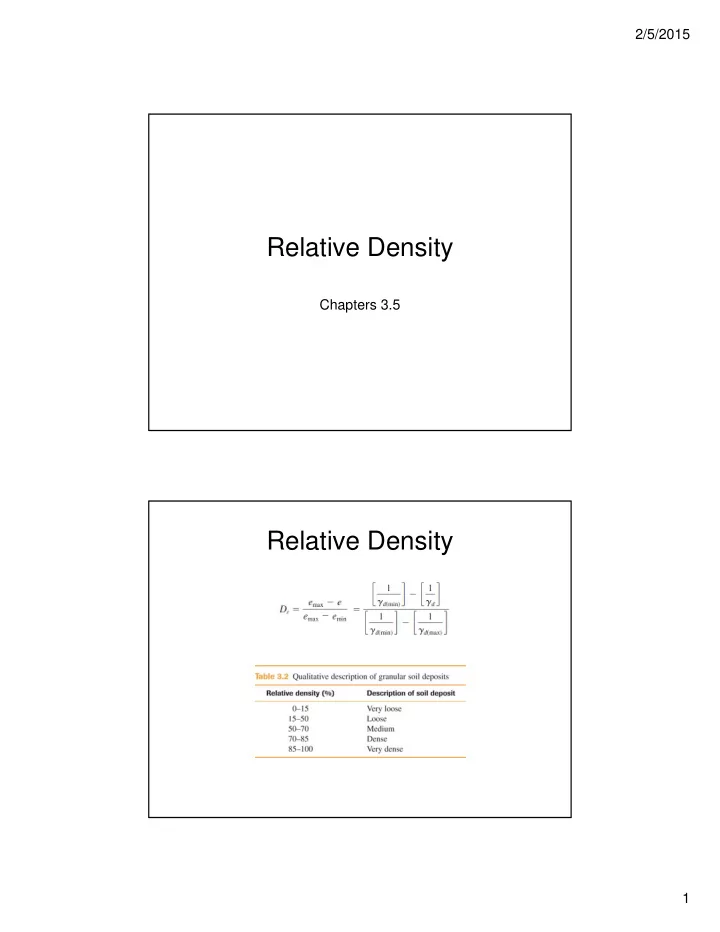
2/5/2015 Relative Density Chapters 3.5 Relative Density 1 2/5/2015 Minimum Density Pluviate soil from height of 25 mm Maximum Density Vibrate for 8 minutes 2 2/5/2015 Relative Density Correlations Clean sand (0 F c 5%) Sand w/
Pluviate soil from height of 25 mm Vibrate for 8 minutes
Clean sand (0 ≤ Fc ≤ 5%) Sand w/ fines (5 ≤ Fc ≤ 15%) Sand w/ fines and clay (15 ≤ Fc ≤ 30%)
0.072 1.53
BRICK MUD PLAYDOH (crumbly)
20 mm penetration in 5 seconds @ LL
= 38%
~68% ~55% PI = 68% − 55% = 13%
Air Vv = e
1 w/ms
w i i s
SL w w w V 100% m
Dish starts out full !
activity
(unhydrated) (hydrated)
BRICK MUD PLAYDOH (crumbly)
w
(Holtz & Kovacs, An Introduction to Geotechnical Engineering, 1981)
Soil 1: SL = 20 – 6 = 14 Soil 2: SL = 20 + 9 = 29
+6
(Holtz & Kovacs, An Introduction to Geotechnical Engineering, 1981)
Casagrande’s procedure for estimating the shrinkage limit.