
SLIDE 1
9/30/2016 1 Living Kidney Donors The Unspoken Risks Transplant Symposium 2016
Brian K Lee, M.D.
May 14th 2014
Connie Frank Transplant Center
School of Medicine
Pre-Test (True/False)
- There is an abundance of living organ donors in
the community
- Living kidney donors are no more likely to
develop End Stage Renal Disease than non- donors
- The emergence of Chronic Kidney Disease
among donors happen soon after surgery
- Risks to kidney donors far outweighs the
benefits to their recipients
2 School of Medicine
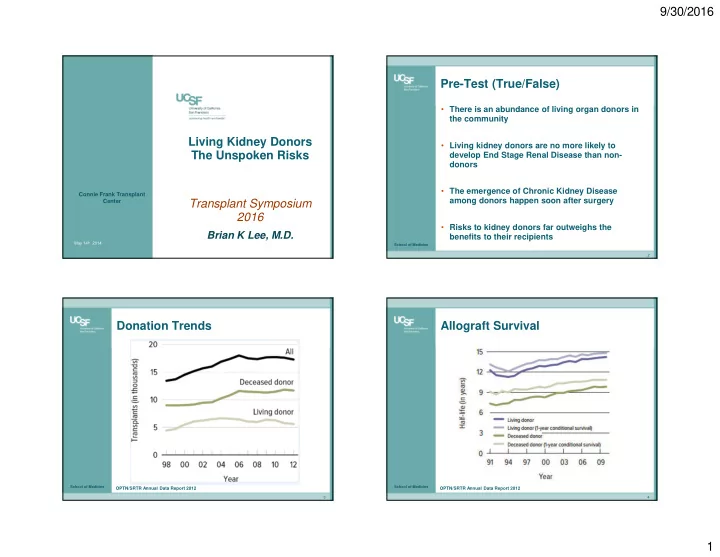
Donation Trends
3
OPTN/SRTR Annual Data Report 2012
School of Medicine
Allograft Survival
4
OPTN/SRTR Annual Data Report 2012