SLIDE 1
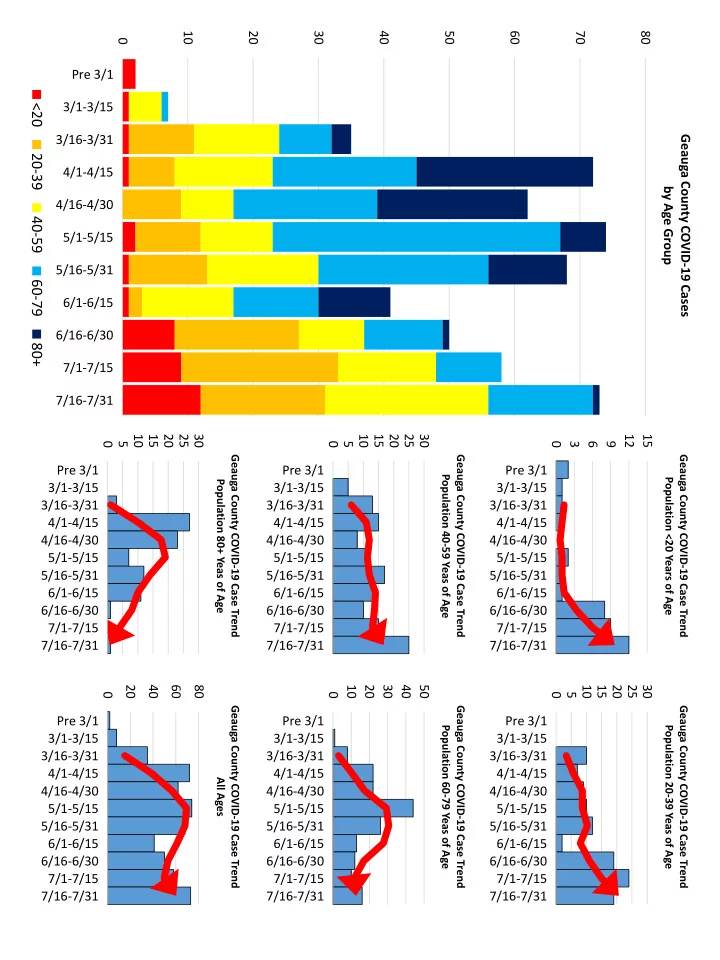
10 20 30 40 50 60 70 80 Pre 3/1 3/1-3/15 3/16-3/31 4/1-4/15 4/16-4/30 5/1-5/15 5/16-5/31 6/1-6/15 6/16-6/30 7/1-7/15 7/16-7/31 Geauga County COVID-19 Cases by Age Group
<20 20-39 40-59 60-79 80+
3 6 9 12 15 Pre 3/1 3/1-3/15 3/16-3/31 4/1-4/15 4/16-4/30 5/1-5/15 5/16-5/31 6/1-6/15 6/16-6/30 7/1-7/15 7/16-7/31
Geauga County COVID-19 Case Trend Population <20 Years of Age
5 10 15 20 25 30 Pre 3/1 3/1-3/15 3/16-3/31 4/1-4/15 4/16-4/30 5/1-5/15 5/16-5/31 6/1-6/15 6/16-6/30 7/1-7/15 7/16-7/31
Geauga County COVID-19 Case Trend Population 20-39 Yeas of Age
5 10 15 20 25 30 Pre 3/1 3/1-3/15 3/16-3/31 4/1-4/15 4/16-4/30 5/1-5/15 5/16-5/31 6/1-6/15 6/16-6/30 7/1-7/15 7/16-7/31
Geauga County COVID-19 Case Trend Population 40-59 Yeas of Age
10 20 30 40 50 Pre 3/1 3/1-3/15 3/16-3/31 4/1-4/15 4/16-4/30 5/1-5/15 5/16-5/31 6/1-6/15 6/16-6/30 7/1-7/15 7/16-7/31
Geauga County COVID-19 Case Trend Population 60-79 Yeas of Age
5 10 15 20 25 30 Pre 3/1 3/1-3/15 3/16-3/31 4/1-4/15 4/16-4/30 5/1-5/15 5/16-5/31 6/1-6/15 6/16-6/30 7/1-7/15 7/16-7/31
Geauga County COVID-19 Case Trend Population 80+ Yeas of Age
20 40 60 80 Pre 3/1 3/1-3/15 3/16-3/31 4/1-4/15 4/16-4/30 5/1-5/15 5/16-5/31 6/1-6/15 6/16-6/30 7/1-7/15 7/16-7/31
Geauga County COVID-19 Case Trend All Ages
SLIDE 2
2 4 6 8 10 12 14 16 18 20 Pre 3/1 3/1-3/15 3/16-3/31 4/1-4/15 4/16-4/30 5/1-5/15 5/16-5/31 6/1-6/15 6/16-6/30 7/1-7/15 7/16-7/31
Geauga County COVID-19 Hospitalizations
Average Number of Geauga County Deaths March 1 through July 31
COVID-19 (U07.1) 44 Ischaemic heart disease (I20-I25) 41 Chronic lower respiratory diseases (J40-J47) 19 Malignant neoplasm of the lung and bronchus (C34) 17 Accidents (unintentional injuries) (V01-X59,Y85-Y86) 17 Cerebrovascular diseases (I60-I69) 14 Alzheimer disease (G30) 9 Diabetes mellitus (E10-E14) 9 Influenza and pneumonia (J09-J18) 8 Malignant neoplasm of the pancreas (C25) 7 Hypertensive diseases 6 Malignant neoplasm of the breast (C50) 6 Intentional self-harm (suicide) (*U03,X60-X84,Y87.0) 6 Septicemia (A40-A41) 5 Parkinson disease (G20-G21) 5 Chronic liver disease and cirrhosis (K70,K73-K74) 5 Nephritis, nephrotic syndrome and nephrosis (N00-N07,N17-N19,N25-N27) 5
2 4 6 8 10 12 14 16 Pre 3/1 3/1-3/15 3/16-3/31 4/1-4/15 4/16-4/30 5/1-5/15 5/16-5/31 6/1-6/15 6/16-6/30 7/1-7/15 7/16-7/31 8/1-8/16
Geauga County COVID-19 Deaths
SLIDE 3
Geauga County Risk Assessment Indicators (8/13/2020)
SLIDE 4
SLIDE 5 Ohio Geauga County Geauga County represents 0.8%
- f the state’s population.
Geauga County represents 0.5%
- f the state’s COVID-19 cases.
Geauga County represents 0.8%
hospitalizations. Geauga County represents 1.2 %
- f the state’s COVID-19 deaths.
(Deaths represent current status but may change over the course
- f several weeks as cause of
death may take weeks to determine.) Geauga County represents 0.6%
- f the state’s presumed
- recovered. (“Recovered” is
currently defined as those whose symptom onset >21 days who have not died.)
SLIDE 6
Geauga County is within 1 standard deviation below the mean number of cases per 100,000 population (762). We are not statistically significantly different from the other counties in the region. However, we are 34% lower than the cases per 100,000 for the region as a whole. Geauga County is within 1 standard deviation below the mean number of hospitalizations per 100,000 population (121). We are not statistically significantly different from the other counties in the region. However, we are 66% lower than the hospitalizations per 100,000 for the region as a whole. Geauga County is within 1 standard deviation below the mean number of deaths per 100,000 population (51.3). We are not statistically significantly different from the other counties in the region. However, we are 3% higher than the deaths per 100,000 for the region as a whole.