
SLIDE 1
6/9/2017 1
Using deep learning to delineate pathological correlates of mammographic breast density from diagnostic image-guided breast biopsies
Maeve Mullooly PhD MPH Cancer Prevention Fellow Division of Cancer Epidemiology and Genetics maeve.mullooly@nih.gov
2
No disclosures
3
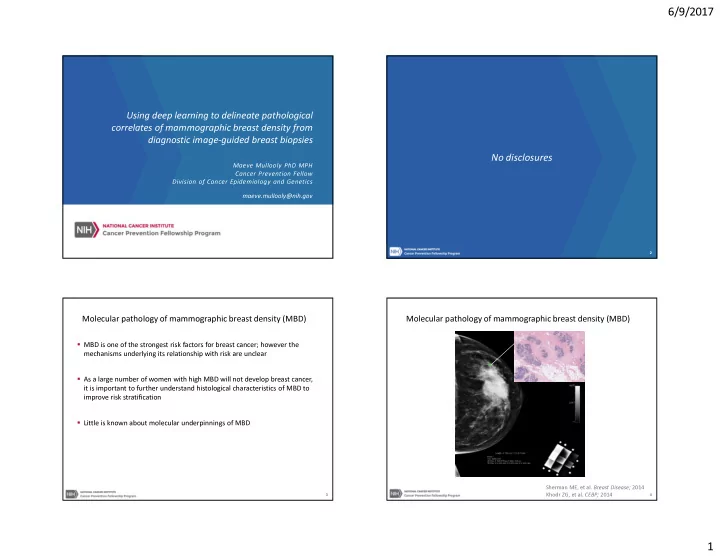
Molecular pathology of mammographic breast density (MBD)
MBD is one of the strongest risk factors for breast cancer; however the mechanisms underlying its relationship with risk are unclear As a large number of women with high MBD will not develop breast cancer, it is important to further understand histological characteristics of MBD to improve risk stratification Little is known about molecular underpinnings of MBD
4
Sherman ME, et al. Breast Disease; 2014 Khodr ZG, et al. CEBP; 2014