
SLIDE 1
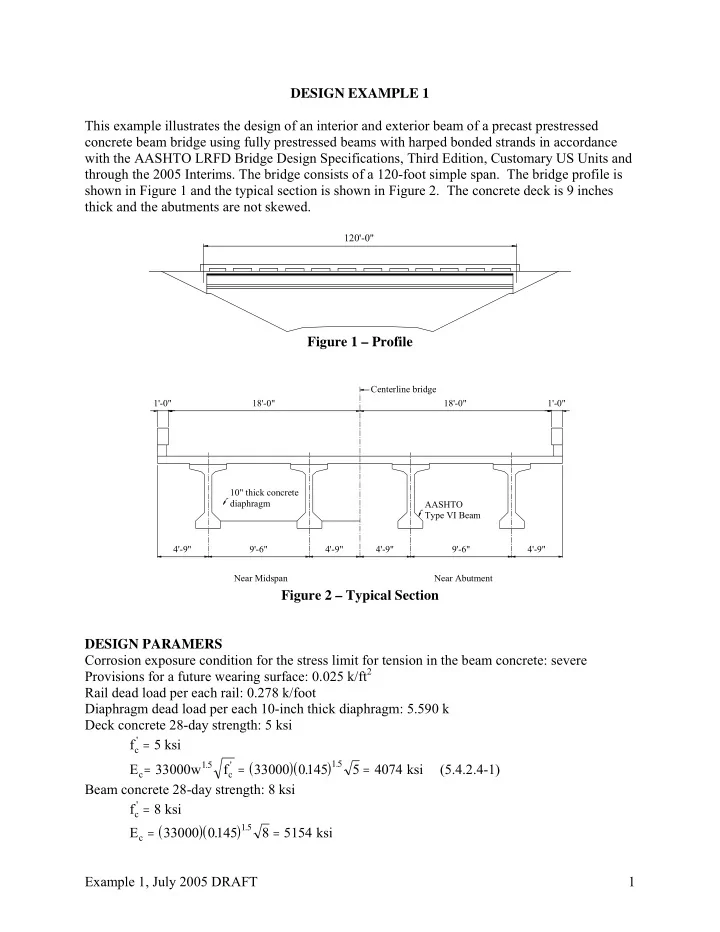
DESIGN EXAMPLE 1 This example illustrates the design of an interior and exterior beam of a precast prestressed concrete beam bridge using fully prestressed beams with harped bonded strands in accordance with the AASHTO LRFD Bridge Design Specifications, Third Edition, Customary US Units and through the 2005 Interims. The bridge consists of a 120-foot simple span. The bridge profile is shown in Figure 1 and the typical section is shown in Figure 2. The concrete deck is 9 inches thick and the abutments are not skewed.
120'-0"
Figure 1 – Profile
Centerline bridge 1'-0" 18'-0" 18'-0" 1'-0" AASHTO Type VI Beam 4'-9" 9'-6" 4'-9" 4'-9" 9'-6" 4'-9" Near Abutment Near Midspan 10" thick concrete diaphragm
Figure 2 – Typical Section DESIGN PARAMERS Corrosion exposure condition for the stress limit for tension in the beam concrete: severe Provisions for a future wearing surface: 0.025 k/ft2 Rail dead load per each rail: 0.278 k/foot Diaphragm dead load per each 10-inch thick diaphragm: 5.590 k Deck concrete 28-day strength: 5 ksi fc
' = 5 ksi
( )( ) E w f
c c
= = =
33000 33000 0145 5 4074
15 15 . ' .
. ksi (5.4.2.4-1) Beam concrete 28-day strength: 8 ksi fc
' = 8 ksi
( )( ) Ec =
=
33000 0145 8 5154
15
.
.