5 9 2017
play

5/9/2017 Customer and Retail Choice in California: Customer and - PowerPoint PPT Presentation

5/9/2017 Customer and Retail Choice in California: Customer and Retail Choice in California California Electricity 101 As of end of 2016, 27% CA has high electric rates Renewable Energy Mix but low electric bills: Avg: $0.16/kWh - $90/month


  1. 5/9/2017 Customer and Retail Choice in California: Customer and Retail Choice in California California Electricity 101 As of end of 2016, 27% CA has high electric rates Renewable Energy Mix but low electric bills: Avg: $0.16/kWh - $90/month Nicolas Chaset Chief of Staff to Commission President Michael Picker California Public Utilities Commission May, 10, 2017 1 2 Customer and Retail Choice in California: 
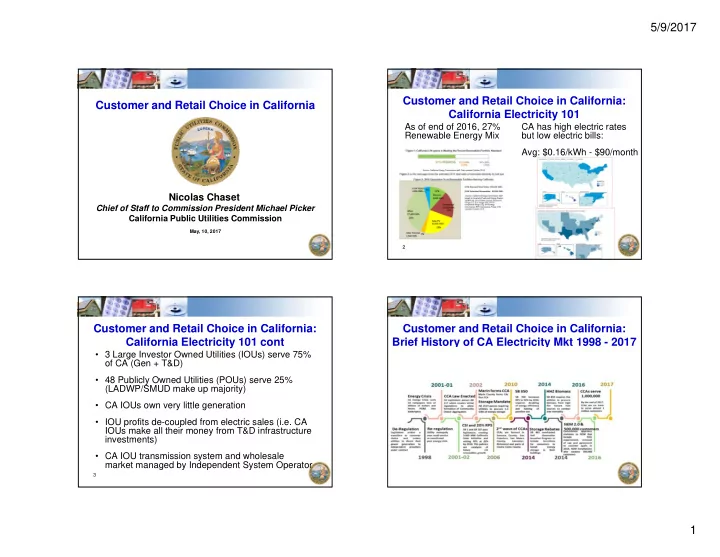
Customer and Retail Choice in California: California Electricity 101 cont Brief History of CA Electricity Mkt 1998 - 2017 • 3 Large Investor Owned Utilities (IOUs) serve 75% of CA (Gen + T&D) • 48 Publicly Owned Utilities (POUs) serve 25% (LADWP/SMUD make up majority) • CA IOUs own very little generation • IOU profits de-coupled from electric sales (i.e. CA IOUs make all their money from T&D infrastructure investments) • CA IOU transmission system and wholesale market managed by Independent System Operator 3 4 1

  2. 5/9/2017 Customer and Retail Choice in California: Customer and Retail Choice in California: Major Trends: CCA Major Trends: NEM • Community Choice Aggregators are legal entities • CA has over 5,200 MWs and 650,000 customers on Net formed by cities and counties to aggregate Energy Metering (NEM) (roughly 5% of peak demand) customer electric demand and procure electricity • 1/16 CPUC revised NEM to require all new NEM on behalf of these customers as an alternative to customers to take Time of Use rates, pay $100 the incumbent utility connection fee and include $0.02-$0.03/kWh non- • First CCA was formed in Marin County in 2010 bypassable charge. At same time, CPUC eliminated cap on NEM • CCAs now serve almost 1,000,000 (mostly around the Bay of San Francisco) • NEM installations have slowed since new NEM rules came into place and industry coming to grips with Time • CCAs are under consideration in every major of Use requirements city/county in CA – up to 15m Californians could be served by a CCA by middle of 2020s • 323 MWs in Q4 2016 5 6 • 157 MWs in Q1 2017 Customer and Retail Choice in California: Customer and Retail Choice in California: Major Trends: Energy Storage Where are we going? • Between CCA, NEM and legacy Direct Access, 25% • AB 2541 (2010) required CPUC to develop energy of IOU load will be served by a ‘competitive’ supplier storage mandate by end of 2017 • CPUC approves requirement for IOUs to procure • Set to grow significantly – up to +80% by middle of 1.3 GWs of energy storage by 2020 2020s – under current regulatory framework • Customer sited energy storage can currently • Major theme driving departure from IOU bundled access $500m in incentives through Self service to NEM and CCA is technology innovation Generation Incentive Program and cost reduction (i.e. very low cost solar PV that allows thirds parties to undercut IOU rates) • SCE leading way in energy storage procurement with over 250 MWs of energy storage contracts • CCAs typically sell electricity that is more renewable and 5% to 10% cheaper than IOU • 30 MWs Tesla project installed in under 6 months to respond to Aliso Canyon outage 7 8 • CCAs benefitting from utility scale PV cost declines while IOUs have higher cost legacy contracts 2

  3. 5/9/2017 Customer and Retail Choice in California: Customer and Retail Choice in California: What are we doing about it? What are we doing about it? • CPUC is starting to review a number of major • CPUC is opening Rulemaking on Utility and Regulatory Model in Technology Driven Market regulations • Expect to review role of IOU as primary load serving entity (i.e. what are implications if IOU doesn’t sell kWh anymore?) • Power Charge Indifference Adjustment: tool used to allocate costs of above market generation to CCAs and • Consider lessons learned from fully-competitive markets like Texas, Direct Access providers technology-driven markets like Hawaii, and hydrid markets like New York • Integrated Resource Planning: As part of • Assess how CPUC can effectively regulate in environment where implementation of 50% RPS, CPUC considering how it millions of customers can respond to price signals automatically and would oversee procurement plans from potentially technology moves faster than market design or regulations dozens of providers – today IOUs procure 85% of load • All while focusing on positioning California to achieve its BOLD so CPUC can focus on their three plans energy goals • NEM 3.0: CPUC in early planning for further refinement • 40% Below 1990 GHG Levels by 2030 while Accelerating CA Economic Growth of NEM • 50% RPS by 2030 • 1.5 million zero emission vehicles by 2025 And…. • 2x Energy Efficiency 9 10 Thank you! For Additional Information: www.cpuc.ca.gov 11 3

Download Presentation
Download Policy: The content available on the website is offered to you 'AS IS' for your personal information and use only. It cannot be commercialized, licensed, or distributed on other websites without prior consent from the author. To download a presentation, simply click this link. If you encounter any difficulties during the download process, it's possible that the publisher has removed the file from their server.

Recommend


More recommend