4/18/2017 Outlines The Diverse Data, User Driven Services Data - - PDF document

4 18 2017
SMART_READER_LITE
LIVE PREVIEW

4/18/2017 Outlines The Diverse Data, User Driven Services Data - - PDF document

https://ntrs.nasa.gov/search.jsp?R=20170004003 2018-04-10T09:40:26+00:00Z 4/18/2017 Outlines The Diverse Data, User Driven Services Data Products at GES DISC and Overview of remote sensing and model data at the Power of Giovanni at NASA


slide-1
SLIDE 1

4/18/2017 1

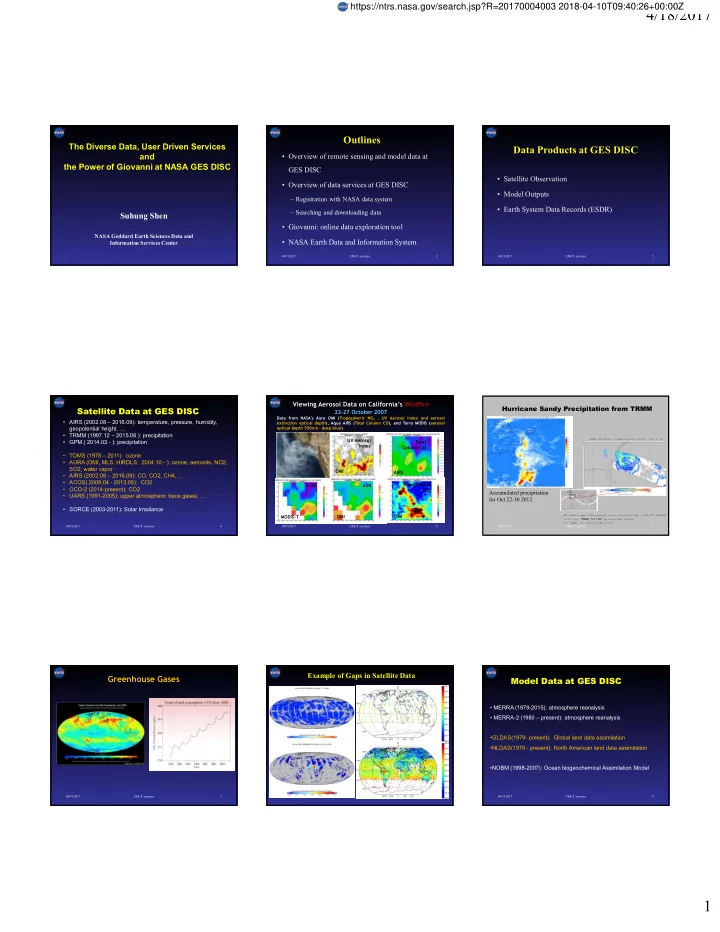
The Diverse Data, User Driven Services and the Power of Giovanni at NASA GES DISC Suhung Shen

NASA Goddard Earth Sciences Data and Information Services Center

Outlines

  • Overview of remote sensing and model data at

GES DISC

  • Overview of data services at GES DISC

– Registration with NASA data system – Searching and downloading data

  • Giovanni: online data exploration tool
  • NASA Earth Data and Information System

04/19/2017 UMCP seminar 2

Data Products at GES DISC

  • Satellite Observation
  • Model Outputs
  • Earth System Data Records (ESDR)

04/19/2017 UMCP seminar 3 04/19/2017 UMCP seminar

Satellite Data at GES DISC

  • AIRS (2002.08 – 2016.09): temperature, pressure, humidity,

geopotential height, …

  • TRMM (1997.12 – 2015.06 ): precipitation
  • GPM ( 2014.03 - ): precipitation
  • TOMS (1978 – 2011): ozone
  • AURA (OMI, MLS, HIRDLS, 2004.10 - ): ozone, aerosols, NO2,

SO2, water vapor

  • AIRS (2002.08 – 2016.09): CO, CO2, CH4, …
  • ACOS( 2009.04 - 2013.05): CO2
  • OCO-2 (2014-present): CO2
  • UARS (1991-2005): upper atmospheric trace gases, …
  • SORCE (2003-2011): Solar Irradiance

4

23-27 October 2007

Data from NASA’s Aura OMI (Tropospheric NO2 , UV Aerosol Index and aerosol extinction optical depth), Aqua AIRS (Total Column CO), and Terra MODIS (aerosol

  • ptical depth 550nm - deep blue)

Viewing Aerosol Data on California’s Wildfire

Tropospheric NO2 OMI UV Aerosol Index OMI Total Column CO AIRS AOD OMI MODIS-T A OD

5 04/19/2017 UMCP seminar 04/19/2017 UMCP seminar

Hurricane Sandy Precipitation from TRMM

6

Accumulated precipitation for Oct 22-30 2012

Greenhouse Gases

7 04/19/2017 UMCP seminar 04/19/2017 UMCP seminar 8

Example of Gaps in Satellite Data

04/19/2017 UMCP seminar

Model Data at GES DISC

  • MERRA (1979-2015): atmosphere reanalysis
  • MERRA-2 (1980 – present): atmosphere reanalysis
  • GLDAS(1979- present): Global land data assimilation
  • NLDAS(1979 - present): North American land data assimilation
  • NOBM (1998-2007): Ocean biogeochemical Assimilation Model

9

https://ntrs.nasa.gov/search.jsp?R=20170004003 2018-04-10T09:40:26+00:00Z

slide-2
SLIDE 2

4/18/2017 2

M2T1NXAER.5.12.4:SO2CMASS

04/19/2017 UMCP seminar 11 04/19/2017 UMCP seminar

Products from MEaSUREs: ESDR

An ESDR (Earth System Data Records) is defined as a unified and coherent set of observations of a given parameter of the Earth system, which is optimized to meet specific requirements for addressing science questions.

  • Reprocessing and Goddard Satellite-based Surface Turbulent Fluxes (GSSTF) Data Set

for Global Water and Energy Cycle Research (1987-2008)

  • Creating a Long Term Multi-Sensor Ozone Data Record (1970-2014)
  • Consistent Long-Term Aerosol Data Records over Land and Ocean from SeaWIFS

(1979-2010)

  • Global Ozone Chemistry and Related trace gas Data Records for the Stratosphere

(1979-2012)

  • Earth Surface and Atmosphere Reflectivity Since 1979 from Multiple Satellites

(TOMS, SBUV , SBUV-2, OMI, SeaWIFS, NPP, and NPOESS) (1978-2012)

  • A Multi-Sensor Water Vapor Climate Data Record Using Cloud Classification (2006-

2012)

  • Multi-Decadal Sulfur Dioxide Climatology from Satellite Instruments
  • Globally Merged, Reconciled and Gridded Observations of Near-Surface Atmospheric

and Land Surface Properties

12

  • Over view of data services at GES DISC

– Registration with NASA data system – Searching and downloading data

04/19/2017 UMCP seminar 13

Earth Science Missions

https://science.nasa.gov

04/19/2017 UMCP seminar 14

Past (36) Operating (28) Future (24)

NASA Data Centers

04/19/2017 UMCP seminar 15

Courtesy: https://earthdata.nasa.gov Total 12 Data Centers

Register with Earthdata system Data are free, most data are unrestricted Data citation is encouraged

Registration to NASA Data System

04/19/2017 UMCP seminar 16

 Register with Earthdata system  Add data access applications, e.g. “NASA GESDISC DATA ARCHIVE” https://urs.earthdata.nasa.gov/

Data Services at GES DISC

Data downloading Services:

HTTPS: Direct access Data Search System: Search and download Data Subsetter: parameter and spatial subsetter

Visualization Services:

Giovanni : Online Data Visualization and Analysis

Interoperable Services:

OPeNDAP : Open-source Project for a Network Data Access Protocol GDS : GrADS Data Server OGC /WMS : Open Geospatial Consortium /Web Map Service Online Helps: FAQ: short description of frequently asked questions Data How-To: (Recipes) Detailed examples on How to access and work with data

04/19/2017 UMCP seminar 17

NASA GES DISC New Portal

04/19/2017 UMCP seminar 18

slide-3
SLIDE 3

4/18/2017 3

04/19/2017 UMCP seminar 19

NASA GES DISC New Portal

Search Data Search Document Keywords Spatial and temporal Range Browse Data by Category

04/19/2017 UMCP seminar 20

NASA GES DISC New Portal

  • Login
  • Feedback
  • Twitter
  • Youtube

Aerosol Optical Depth/Thickness

04/19/2017 UMCP seminar 21

NASA GES DISC New Portal

Narrow down the search Sorting Columns

04/19/2017 UMCP seminar 22

Product Landing Page

04/19/2017 UMCP seminar 23

Data Citation and DOI

04/19/2017 UMCP seminar 24

Data How-To (formally data recipes)

  • Giovanni: online data exploration tool

04/19/2017 UMCP seminar 25

 With a few mouse clicks, obtain information easily

  • n the atmosphere, ocean and land around the

world.  No need to learn data formats to retrieve & process data.  Try various parameter combinations measured by different instruments.  All the statistical analyses are done via a regular Web browser.

Geospatial Interactive Online Visualization ANd aNalysis Infrastructure (Giovanni)

https://giovanni.gsfc.nasa.gov https://giovanni.gsfc.nasa.gov Navigation

slide-4
SLIDE 4

4/18/2017 4

Giovanni Features

Single Parameter :

  • Lat–Lon map of time-averaged data
  • Time-series of area-averaged data
  • Hovmöller diagram/cross section map
  • Histogram
  • Vertical profile, cross-section map
  • Zonal mean
  • Animations of Lat–Lon map over time
  • Climatology & Anomaly analysis

Multi-parameters:

  • Scatter plots with regression statistics
  • Temporal correlation maps
  • Lat–Lon map overlain with 2nd parameter

contour plot

  • Time-series differences
  • Lat–Lon map differences
  • Regridding (for different spatial resolutions)

Output Features:

  • Data: ASCII, netCDF;
  • Image: PNG, Geotiff, and KMZ
  • Provides WMS and WCS to other Web servers to get maps or data from Giovanni

Signatures of Hurricane Sandy from Giovanni

Hurricane Sandy, know as Frankenstorm, 2012.10. 24-31, estimated total damage is more $50 billion

2012 October 27-29

Total Ozone OMI Cloud Top Pressure Cloud Top Temperature AIRS Cloud Fraction TRMM Precipitation

29 04/19/2017

AIRS AIRS

UMCP seminar

NLDAS Reveals Soil Moisture Change with Giovanni Tropical Storm Lee , Sep 2011

Soil Moisture 2011.09.02-09 Precipitation 2011.09.02-09

04/19/2017 30 UMCP seminar

Accumulated rainfall exceeding 10 inches (254 mm), over Pennsylvania areas

Level 3 Daily Aerosols 21-27 October 2007

SeaWiFS Deep Blue Aerosols during California’s Wildfire with Giovanni

31 04/19/2017 UMCP seminar

View AIRS Temperature Profile with Giovanni Cross Section averaged for 30oN-34oN

Springtime heating of atmosphere above Tibetan Plateau associated with Monsoon onset

Other AIRS data: Water vapor, Geopotential

height, pressure, OLR, CH4, CO, CO2, etc.

March May

View MERRA-2 SO2 Profile with Giovanni On 1991.06.30 After Volcano Mt Pinatubo

Terra Aqua MODIS Aura OMI MISR Missions Instruments MERRA-2 US EPA PM2.5 (DataFed) AERONET

Example: Comprehensive Multi-Sensor Data Environment for Aerosol Studies

Models Ground-based Parasol Polder CALIPSO CALIOP …. … OrbView-2 SeaWiFS

Inter-comparisons of Aerosols

MODIS-T MODIS-A SeaWiFS-DeepBlue MODIS-A DeepBlue OMI MISR

April 1-30 2005 averaged daily aerosols from MODIS, MISR, OMI, and SeaWiFS at 550 nm, and OMI at 500nm

35 04/19/2017 UMCP seminar

Correlations of Daily MODIS Terra and Aqua Aerosols

04/19/2017 36 UMCP seminar

Collection-5

slide-5
SLIDE 5

4/18/2017 5

UMCP seminar 37

Artifact in AOD Correlation Explained!

Observation Time (local time) differences between Terra and Aqua

04/19/2017

Dataday definition in Level 3 Aerosols

Level 3 gridded data are easy to use by modelers, application users, climate scientists… but also easy to get wrong conclusions…. Level 3 daily products are generated by binning Level 2 data belonging to one day onto a certain spatial grid according to a Dataday definition: 1.UTC (00:00-24:00Z) : MODIS-Atmospheric (V5) 2.Local Time: MISR, MODIS-ocean, AIRS, OMI, TOMS, SeaWiFS

04/19/2017 38 UMCP seminar

Correlations of Daily MODIS Terra and Aqua Aerosols

04/19/2017 39 UMCP seminar

Collection-6

04/19/2017 UMCP seminar 40

Recommendation to use Giovanni: read carefully documents about data, retrieval algorithm, and data quality, …

Published Paper using Giovanni:

Sample #1- Regional Aerosol Study

04/19/2017 UMCP seminar 41

  • S. K. Satheesh1,
  • K. Moorthy2,
  • Y

. J. Kaufman

Figure 9. Regional distribution of aerosol optical depth (550 nm) during (a) March 2001 and (b) February 2003 (http://lake.nascom.nasa.gov/movas).

  • V. Vinoj, … Y. J. Kaufman, 2004,

Radiative forcing by aerosols over the Bay of Bengal region derivedfrom shipborne, island- based, and satellite (Moderate-Resolution Imaging Spectroradiometer) observations . JGR, 109, DOI: 10.1029/2003JD004329

04/19/2017 UMCP seminar 42

Cools, et al. (2012). An early warning system for flash floods in hyper - arid Egypt. Natural Hazards and Earth System Sciences, 12, 443- 457.

  • Fig. 7. Selection of 3-hourly rainfall

estimates from TRMM for the events in December 2000, October 2002, October 2004, and January 2010. Images have been extracted with NASA’s Giovanni ( http://giovanni.gsfc.nasa.gov)

Published Paper using Giovanni:

Sample #2: Flash Flood Early Warning System

04/19/2017 UMCP seminar 43

Stewart, D.B. and Barber, D.G. (2010). The ocean-sea ice- atmosphere system of the Hudson Bay Complex. In A Little Less Arctic, S. H. Ferguson, L.L. Loseto, and M.L. Mallory, Eds., Springer, Netherlands, 1-38

  • Fig. 8 Summer (July–September)

sea surface temperature in 2006 (Prepared using the Giovanni

  • nline data system, developed and

maintained by the NASA Goddard Earth Sciences (GES) Data and Information Services Center (DISC).

Published Paper using Giovanni:

Sample #3: Climate Change and Arctic SST

NASA Earth Science Data Search

44 04/19/2017 UMCP seminar

https://search.earthdata.nasa.gov

Relevant Resources

45 04/19/2017 UMCP seminar

 NASA EOS Data and Information System (https://earthdata.nasa.gov)

  • user-resources/outreach-products : list of NASA products
  • user-resources/sensing-our-planet : case studies of use remote sensing

data  Applied remote sensing training: https://arset.gsfc.nasa.gov/  WorldView (https://worldview.earthdata.nasa.gov)  NASA’s Earth Observatory http://earthobservatory.nasa.gov/  NASA’s Visible Earth http://visibleearth.nasa.gov/  NASA Earth Observations http://neo.sci.gsfc.nasa.gov/Search.html  Near Real-Time data and imagery: https://earthdata.nasa.gov/earth-

  • bservation-data/near-real-time
slide-6
SLIDE 6

4/18/2017 6

04/19/2017 UMCP seminar 46

https://disc.sci.gsfc.nasa.gov

Question & Feedback: gsfc-help-disc@lists.nasa.gov

47

March 2014 - present September 2014 - present

Examples of Mission poster