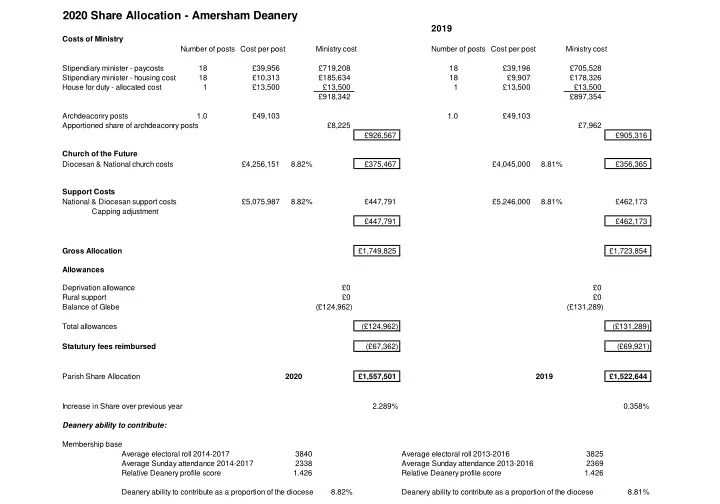

2020 Share Allocation - Amersham Deanery
2019
Costs of Ministry Number of posts Cost per post Ministry cost Number of posts Cost per post Ministry cost Stipendiary minister - paycosts 18 £39,956 £719,208 18 £39,196 £705,528 Stipendiary minister - housing cost 18 £10,313 £185,634 18 £9,907 £178,326 House for duty - allocated cost 1 £13,500 £13,500 1 £13,500 £13,500 £918,342 £897,354 Archdeaconry posts 1.0 £49,103 1.0 £49,103 Apportioned share of archdeaconry posts £8,225 £7,962 £926,567 £905,316 Church of the Future Diocesan & National church costs £4,256,151 8.82% £375,467 £4,045,000 8.81% £356,365 Support Costs National & Diocesan support costs £5,075,987 8.82% £447,791 £5,246,000 8.81% £462,173 Capping adjustment £447,791 £462,173 Gross Allocation £1,749,825 £1,723,854 Allowances Deprivation allowance £0 £0 Rural support £0 £0 Balance of Glebe (£124,962) (£131,289) Total allowances (£124,962) (£131,289) Statutury fees reimbursed (£67,362) (£69,921) Parish Share Allocation 2020 £1,557,501 2019 £1,522,644 Increase in Share over previous year 2.289% 0.358% Deanery ability to contribute: Membership base Average electoral roll 2014-2017 3840 Average electoral roll 2013-2016 3825 Average Sunday attendance 2014-2017 2338 Average Sunday attendance 2013-2016 2369 Relative Deanery profile score 1.426 Relative Deanery profile score 1.426 Deanery ability to contribute as a proportion of the diocese 8.82% Deanery ability to contribute as a proportion of the diocese 8.81%