SLIDE 1
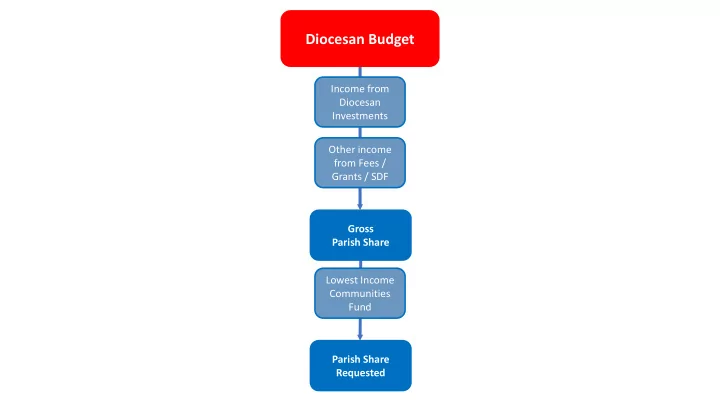
Diocesan Budget
Income from Diocesan Investments Other income from Fees / Grants / SDF Gross Parish Share Lowest Income Communities Fund Parish Share Requested
SLIDE 2
Parish Share Requested Deanery Ministry Allocated Weighting: 70% Deanery Attendance Weighting: 30% Modified by Ability to Give drawn from Income (Experian) Data Reapportioned to take account of the LICF 30 Parishes (N&S has 1) Initial Deanery Allocation
SLIDE 3 Diocesan Reserves if needed to balance budget Newark & S’Well £605,000
Is this more than was PAID in 2017? YES (inc N&S) Increase by 2017 Paid +5.3% (CPI+3%) Hold at 2017 paid NO Actual Share Request £6,022,900 Parish Share Requested
SLIDE 4
Benefice Ministry Allocated Weighting: 50% Modified by locally determined ability to give (+/- 10%) Benefice Ministry Allocated Weighting: 50% Allowance for Buildings Newark & S’Well £605,000 +£30,000 LICF =£635,000
SLIDE 5
Calculated Share Balderton/Barnby/Collingham £48,095 Beck & Trent £36,351 East Trent £43,528 Octave £30,299 Edingley & Halam £25,892 Farndon/Hawton £31,212 Newark: St M & St L £61,467 Newark: Christchurch £41,164 Farnsfield et al £31,911 North Western £39,293 Ollerton / B&E £39,332 Riverside £33,284 West Trent £55,520 Southwell £75,216 Tuxford £42,392
SLIDE 6
Is this more than was PAID in 2017?
SLIDE 7
Calculated Share 2017 +5.3% Balderton/Barnby/Collingham £48,095 £66,303 Beck & Trent £36,351 £35,787 East Trent £43,528 £27,429 Octave £30,299 £24,878 Edingley & Halam £25,892 £22,386 Farndon/Hawton £31,212 £35,502 Newark: St M & St L £61,467 £55,388 Newark: Christchurch £41,164 £18,954 Farnsfield et al £31,911 £38,030 North Western £39,293 £19,348 Ollerton / B&E £39,332 £46,959 Riverside £33,284 £32,486 West Trent £55,520 £63,137 Southwell £75,216 £87,817 Tuxford £42,392 £30,296
SLIDE 8
Is ‘Paid 2017+5.3%’ more than Calculated Share? YES Hold at 2017 paid +5.3%
SLIDE 9
Calculated Share 2017 +5.3% Request Balderton/Barnby/Collingham £48,095 £66,303 £66,303 Beck & Trent £36,351 £35,787 East Trent £43,528 £27,429 Octave £30,299 £24,878 Edingley & Halam £25,892 £22,386 Farndon/Hawton £31,212 £35,502 £35,502 Newark: St M & St L £61,467 £55,388 Newark: Christchurch £41,164 £18,954 Farnsfield et al £31,911 £38,030 £38,030 North Western £39,293 £19,348 Ollerton / B&E £39,332 £46,959 £46,959 Riverside £33,284 £32,486 West Trent £55,520 £63,137 £63,137 Southwell £75,216 £87,817 £87,817 Tuxford £42,392 £30,296
SLIDE 10
Is ‘Paid 2017+5.3%’ more than Calculated Share? NO Increase in line with Initial Allocation
SLIDE 11
Calculated Share 2017 +5.3% Request Balderton/Barnby/Collingham £48,095 £66,303 Beck & Trent £36,351 £35,787 £36,351 East Trent £43,528 £27,429 £43,528 Octave £30,299 £24,878 £30,299 Edingley & Halam £25,892 £22,386 £25,892 Farndon/Hawton £31,212 £35,502 Newark: St M & St L £61,467 £55,388 £61,467 Newark: Christchurch £41,164 £18,954 £41,164 Farnsfield et al £31,911 £38,030 North Western £39,293 £19,348 £39,293 Ollerton / B&E £39,332 £46,959 Riverside £33,284 £32,486 £33,284 West Trent £55,520 £63,137 Southwell £75,216 £87,817 Tuxford £42,392 £30,296 £42,392
SLIDE 12
Is ‘Paid 2017+5.3%’ more than Calculated Share? YES NO Hold at 2017 paid +5.3% Increase in line with Initial Allocation Remove LICF for Ollerton & Christ Church Figure Requested for each Benefice
SLIDE 13
Calculated Share 2017 +5.3% Request Balderton/Barnby/Collingham £48,095 £66,303 £66,303 Beck & Trent £36,351 £35,787 £36,351 East Trent £43,528 £27,429 £43,528 Octave £30,299 £24,878 £30,299 Edingley & Halam £25,892 £22,386 £25,892 Farndon/Hawton £31,212 £35,502 £35,502 Newark: St M & St L £61,467 £55,388 £61,467 Newark: Christchurch £41,164 £18,954 £26,164 Farnsfield et al £31,911 £38,030 £38,030 North Western £39,293 £19,348 £39,293 Ollerton / B&E £39,332 £46,959 £31,959 Riverside £33,284 £32,486 £33,284 West Trent £55,520 £63,137 £63,137 Southwell £75,216 £87,817 £87,817 Tuxford £42,392 £30,296 £42,392
SLIDE 14 Offers received in Response to Requested Figure
Does total of
received add up to at least £605,000?
YES Agree individual Parish Allocations and send them to the Finance Dept
Standing Committee makes the final allocation to Benefices
NO Figure Requested for each Benefice
Standing Committee reviews offers