
SLIDE 1
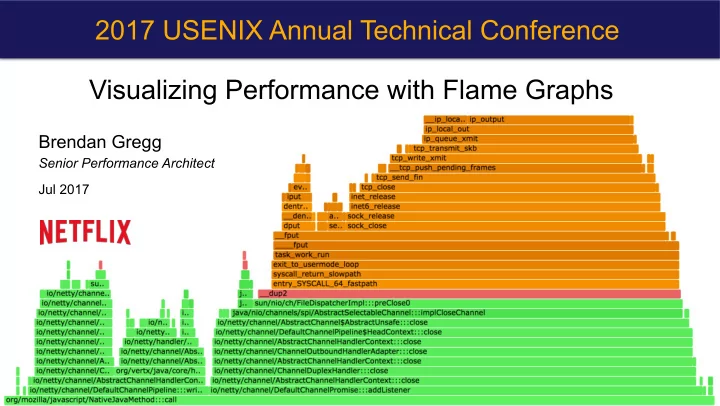
Visualizing Performance with Flame Graphs
Brendan Gregg
Senior Performance Architect Jul 2017
2017 USENIX Annual Technical Conference Visualizing Performance with - - PowerPoint PPT Presentation
2017 USENIX Annual Technical Conference Visualizing Performance with Flame Graphs Brendan Gregg Senior Performance Architect Jul 2017 Visualize CPU -me consumed by all so5ware Kernel Java User-level Agenda 1. CPU Flame graphs 2. Fixing
Brendan Gregg
Senior Performance Architect Jul 2017
Kernel Java User-level
Exception handling consuming CPU
A B block interrupt
A B A A B A syscall
time
– Pros: Low (deterministic) overhead – Cons: Coarse accuracy, but usually sufficient stack samples:
A
$ jstack 1819 […] "main" prio=10 tid=0x00007ff304009000 nid=0x7361 runnable [0x00007ff30d4f9000] java.lang.Thread.State: RUNNABLE at Func_abc.func_c(Func_abc.java:6) at Func_abc.func_b(Func_abc.java:16) at Func_abc.func_a(Func_abc.java:23) at Func_abc.main(Func_abc.java:27)
running parent g.parent g.g.parent
– perf_events (aka "perf")
– DTrace
– Instruments
– XPerf, WPA (which now has flame graphs!)
– Provides the perf command (mulK-tool) – Usually pkg added by linux-tools-common, etc.
– Timer-based sampling – Hardware events – Tracepoints – Dynamic tracing
– Can miss hard interrupt ISRs, but these should be near-zero. They can be measured if needed (I wrote my own tools).
# perf record -F 99 -ag -- sleep 30 [ perf record: Woken up 9 times to write data ] [ perf record: Captured and wrote 2.745 MB perf.data (~119930 samples) ] # perf report -n -stdio […] # Overhead Samples Command Shared Object Symbol # ........ ............ ....... ................. ............................. # 20.42% 605 bash [kernel.kallsyms] [k] xen_hypercall_xen_version |
check_events | |--44.13%-- syscall_trace_enter | tracesys | | | |--35.58%-- __GI___libc_fcntl | | | | | |--65.26%-- do_redirection_internal | | | do_redirections | | | execute_builtin_or_function | | | execute_simple_command [… ~13,000 lines truncated …]
call tree summary
– hBps://github.com/brendangregg/FlameGraph – Takes input from many different profilers – MulKple d3 versions are being developed
– hcp://www.brendangregg.com/FlameGraphs/cpuflamegraphs.html – hcp://queue.acm.org/detail.cfm?id=2927301 – "The Flame Graph" CACM, June 2016
a() b() h() c() d() e() f() g() i()
a() b() h() c() d() e() f() g() i()
h() d() e() i() a() b() c() f() g()
a() b() h() c() d() e() f() g() i()
– green == JIT (eg, Java) – aqua == inlined
– red == user-level* – orange == kernel – yellow == C++
– Randomized to differenKate frames – Or hashed on funcKon name
Java JVM (C++) Kernel
Mixed-Mode
C
* new palece uses red for kernel modules too
– red == more samples – blue == less samples
– Degree of difference
– flamegraphdiff
Differential
more less
top (leaf) merge
search button
from Chrome dev tools
(usually very small) performance opKmizaKon.
# perf record –F 99 –a –g – sleep 30 # perf script […] java 4579 cpu-clock: 7f417908c10b [unknown] (/tmp/perf-4458.map) java 4579 cpu-clock: 7f41792fc65f [unknown] (/tmp/perf-4458.map) a2d53351ff7da603 [unknown] ([unknown]) […]
Broken Java stacks (missing frame pointer)
– Fix by disabling that compiler opKmizaKon: gcc's -fno-omit-frame-pointer – Pros: simple, supported by many tools – Cons: might cost a licle extra CPU
– Cons: costs disk space, and not supported by all profilers. Even possible with JIT?
– Pros: include more internals, such as inlined frames – Cons: limited to applicaKon internals - no kernel
# perf script […] java 8131 cpu-clock: 7fff76f2dce1 [unknown] ([vdso]) 7fd3173f7a93 os::javaTimeMillis() (/usr/lib/jvm… 7fd301861e46 [unknown] (/tmp/perf-8131.map) 7fd30184def8 [unknown] (/tmp/perf-8131.map) 7fd30174f544 [unknown] (/tmp/perf-8131.map) 7fd30175d3a8 [unknown] (/tmp/perf-8131.map) 7fd30166d51c [unknown] (/tmp/perf-8131.map) 7fd301750f34 [unknown] (/tmp/perf-8131.map) 7fd3016c2280 [unknown] (/tmp/perf-8131.map) 7fd301b02ec0 [unknown] (/tmp/perf-8131.map) 7fd3016f9888 [unknown] (/tmp/perf-8131.map) 7fd3016ece04 [unknown] (/tmp/perf-8131.map) 7fd30177783c [unknown] (/tmp/perf-8131.map) 7fd301600aa8 [unknown] (/tmp/perf-8131.map) 7fd301a4484c [unknown] (/tmp/perf-8131.map) 7fd3010072e0 [unknown] (/tmp/perf-8131.map) 7fd301007325 [unknown] (/tmp/perf-8131.map) 7fd301007325 [unknown] (/tmp/perf-8131.map) 7fd3010004e7 [unknown] (/tmp/perf-8131.map) 7fd3171df76a JavaCalls::call_helper(JavaValue*,… 7fd3171dce44 JavaCalls::call_virtual(JavaValue*… 7fd3171dd43a JavaCalls::call_virtual(JavaValue*… 7fd31721b6ce thread_entry(JavaThread*, Thread*)… 7fd3175389e0 JavaThread::thread_main_inner() (/… 7fd317538cb2 JavaThread::run() (/usr/lib/jvm/nf… 7fd3173f6f52 java_start(Thread*) (/usr/lib/jvm/… 7fd317a7e182 start_thread (/lib/x86_64-linux-gn… # perf script […] java 4579 cpu-clock: 7f417908c10b [unknown] (/tmp/… java 4579 cpu-clock: 7f41792fc65f [unknown] (/tmp/… a2d53351ff7da603 [unknown] ([unkn… […]
Java stacks (but no symbols, yet)
– Flame graph may sKll make enough sense
– e.g. Java's -XX:-Inline to disable, but can be 80% slower – Java's -XX:MaxInlineSize and -XX:InlineSmallCode can be tuned a licle to reveal more frames: can even improve performance!
– So that excepKon stack traces make sense – e.g. Java's perf-map-agent can un-inline (unfoldall opKon)
– sysctl -w kernel.perf_event_max_stack=512 – Thanks Arnaldo Carvalho de Melo!
A Java microservice with a stack depth
broken stacks perf_event_max_stack=1024
# perf script Failed to open /tmp/perf-8131.map, continuing without symbols […] java 8131 cpu-clock: 7fff76f2dce1 [unknown] ([vdso]) 7fd3173f7a93 os::javaTimeMillis() (/usr/lib/jvm… 7fd301861e46 [unknown] (/tmp/perf-8131.map) […]
Java Mixed-Mode Flame Graph
Java JVM Kernel GC
– Unless you copy them into the host
– lkml: "[PATCH Kp/perf/core 0/7] namespace tracing improvements"
– Skips the CPU-costly stackcollapse-perf.pl step; see:
hcp://www.brendangregg.com/blog/2016-04-30/linux-perf-folded.html
– Most efficient: no perf.data file, summarizes in-kernel
git clone --depth 1 https://github.com/brendangregg/FlameGraph cd FlameGraph perf record -F 99 -a –g -- sleep 30 perf script | ./stackcollapse-perf.pl |./flamegraph.pl > perf.svg git clone --depth 1 https://github.com/brendangregg/FlameGraph git clone --depth 1 https://github.com/iovisor/bcc ./bcc/tools/profile.py -dF 99 30 | ./FlameGraph/flamegraph.pl > perf.svg
perf record perf script capture stacks write text stackcollapse-perf.pl flamegraph.pl perf.data write samples reads samples folded output perf record perf report –g folded capture stacks folded report awk flamegraph.pl perf.data write samples reads samples folded output
Linux 4.5
count stacks (BPF) folded
flamegraph.pl profile.py
Linux 4.9
Linux 2.6
– Java, Node.js, Python, Ruby, C++, Go, …
– hcp://www.brendangregg.com/FlameGraphs/cpuflamegraphs.html – Also try an Internet search
Flame Graphs
Eg, NeHlix Vector (self-service UI):
Should be open sourced; you may also build/buy your own
# perf record -e page-faults -p PID -g -- sleep 120 RES column in top(1) grows because
hcp://www.brendangregg.com/FlameGraphs/memoryflamegraphs.html
– If code path shouldn't block and looks random, it's an involuntary context switch. I could filter these, but you should have solved them beforehand (CPU load).
# perf record -e context-switches -p PID -g -- sleep 5 vs rxNetty Tomcat
futex sys_poll epoll futex
# perf record -e block:block_rq_insert -a -g -- sleep 60 GC
– For the current perf trace, dump, post-process cycle
– Lower frequency, therefore lower overhead
– Could trace via socket read
# perf probe tcp_sendmsg # perf record -e probe:tcp_sendmsg -a -g -- sleep 1; jmaps # perf script -f comm,pid,tid,cpu,time,event,ip,sym,dso,trace > out.stacks # perf probe --del tcp_sendmsg
TCP sends
# perf record -e LLC-loads -c 10000 -a -g -- sleep 5; jmaps # perf script -f comm,pid,tid,cpu,time,event,ip,sym,dso > out.stacks
– red == instrucKon heavy – blue == cycle heavy (likely memory stall cycles)
zoomed:
More info hcp://www.brendangregg.com/blog/2016-02-01/linux-wakeup-offwake-profiling.html
Stack depth Off-CPU time
file read from disk directory read from disk
Only showing kernel stacks in this example
pipe write path read from disk fstat from disk
hcp://www.brendangregg.com/flamegraphs.html
The off-CPU stack trace often doesn't show the root cause of latency. What is gzip blocked on?
Uses Linux enhanced BPF to merge off-CPU and waker stack in kernel context
Waker task Waker stack Blocked stack Blocked task Stack DirecKon Wokeup
Walking the chain of wakeup stacks to reach root cause
dominates: threads waiKng or polling
hcp://www.brendangregg.com/FlameGraphs/hotcoldflamegraphs.html
hcps://github.com/corpaul/flamegraphdiff
– "The Flame Graph" Communica-ons of the ACM, Vol. 56, No. 6 (June 2016)
– hcp://queue.acm.org/detail.cfm?id=2927301 – hcp://www.brendangregg.com/flamegraphs.html -> hBp://www.brendangregg.com/flamegraphs.html#Updates – hcp://www.brendangregg.com/FlameGraphs/cpuflamegraphs.html – hcp://www.brendangregg.com/FlameGraphs/memoryflamegraphs.html – hcp://www.brendangregg.com/FlameGraphs/offcpuflamegraphs.html – hcp://techblog.neHlix.com/2015/07/java-in-flames.html – hcp://techblog.neHlix.com/2016/04/saving-13-million-computaKonal-minutes.html – hcp://techblog.neHlix.com/2014/11/nodejs-in-flames.html – hcp://www.brendangregg.com/blog/2014-11-09/differenKal-flame-graphs.html – hcp://www.brendangregg.com/blog/2016-01-20/ebpf-offcpu-flame-graph.html – hcp://www.brendangregg.com/blog/2016-02-01/linux-wakeup-offwake-profiling.html – hcp://www.brendangregg.com/blog/2016-02-05/ebpf-chaingraph-prototype.html – hcp://corpaul.github.io/flamegraphdiff/
– hcps://perf.wiki.kernel.org/index.php/Main_Page – hcp://www.brendangregg.com/perf.html
– hcps://github.com/neHlix/vector – hcp://techblog.neHlix.com/2015/04/introducing-vector-neHlixs-on-host.html
– QuesKons? – hcp://www.brendangregg.com – hcp://slideshare.net/brendangregg – bgregg@neHlix.com – @brendangregg Next topic: Performance Superpowers with Enhanced BPF