
SLIDE 1
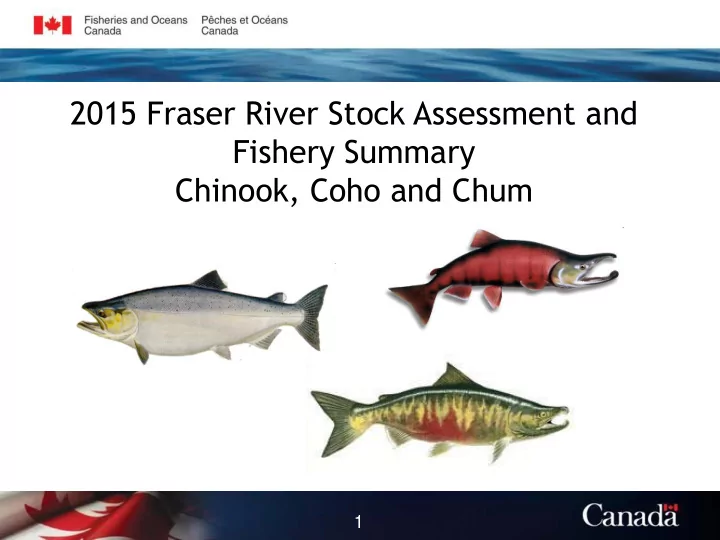
2015 Fraser River Stock Assessment and Fishery Summary Chinook, Coho and Chum
1
2015 Fraser River Stock Assessment and Fishery Summary Chinook, - - PowerPoint PPT Presentation
2015 Fraser River Stock Assessment and Fishery Summary Chinook, Coho and Chum 1 Background and Stock Assessment 2 Fraser River Chinook - Background Diverse group of populations, exhibiting a wide range of life histories, geography, and run
1
2
3 Diverse group of populations, exhibiting a wide range of life histories, geography, and run timing Chinook enter the Fraser River from March thru October Spawning occurs throughout the Fraser, from just above the tidal limits in the Lower Fraser to the upper tributaries of the Stuart basin Juveniles exhibit both stream and ocean life history types Currently managed as five Management Units
–Fraser Spring 42 Chinook –Fraser Spring 52 Chinook –Fraser Summer 52 Chinook –Fraser Summer 41 Chinook –Fraser Fall Chinook
4
–Began the year assuming zone 1 –Spring and Summer 52 Chinook are assessed in-season with an abundance model based on catch from the Albion Test Fishery –On June 15th this in-season model generated an estimate of 48,440 chinook (FN0549). –this estimate resulted in Zone 2 management for 2015 (Zone 1 < 45K; Zone 2 = 45 to 85K; Zone 3 > 85K)
5
–spawner abundance is estimated using a number of methods –mark-recapture studies – Nicola, Harrison, Lower and Mid Shuswap, Chilko –electronic counters – Bonaparte and Deadman –fence counts at Salmon River (Salmon Arm) –remaining assessments are through visual surveys (aerial, foot or float)
Fraser Spring 42 Chinook
–improved over brood in 2015 (avg. >150% for those stocks we have info for so far), and all populations improved although some only barely. –Not as productive as in the past, and the stocks overall are at levels well below MSY . –Continued rebuilding is required before these stocks will attain MSY escapement levels.
Fraser Spring 52 Chinook
–Spring 52 chinook improved over brood in 2015 (avg. ~150%), although there were some populations that did poorly and others that did exceptionally well. –Not as productive as in the past. –Continued rebuilding is required for these.
6
Fraser Summer 52 Chinook
–Almost all Summer 52 populations increased in spawner abundance compared to their parent brood levels, and of the surveyed systems, only Cariboo failed to show improvement over brood abundance
Fraser Summer 41 Chinook
exceeded parent brood levels for all stocks.
170K!
7
Base Period Doubling Goal
8
Base Period Doubling Goal
9
Base Period Doubling Goal
10
Base Period Doubling Goal
11
Escapement Goal Range
12
13 Coho populations spawn throughout the Fraser watershed
–many spawning sites in Lower Fraser River (Below Hells Gate) –Interior Fraser coho return to the Upper Fraser and Thompson Rivers (Above Hells Gate)
Stream-type life history Most return as three year olds, though 10% return as 4 year olds having spent 2 years in fresh water. Coho enter the Lower Fraser River from late August to December
– peak migration period for Interior Fraser Coho from early September to early October
Interior Fraser Coho populations have declined dramatically from peak abundances observed in the 1980’s.
14
abundance
50,000 40,000 30,000 20,000 10,000
60,000 70,000 80,000 90,000 100,000 1977 1978 1979 1980 1981 1982 1983 1984 1985 1986 1987 1988 1989 1990 1991 1992 1993 1994 1995 1996 1997 1998 1999 2000 2001 2002 2003 2004 2005 2006 2007 2008 2009 2010 2011 2012 2013 2014 2015 Geometric Mean of IFC Escapement
3-Y ear Geometric Mean of Interior Fraser Coho Relative to IFCRT Benchmarks
3-year Geometric Mean of IFC Escapement IFCRT Short Term Recovery Objective IFCRT Long Term Recovery Objective
15
200,000 150,000 100,000 50,000 Return Year 250,000 300,000
Total Abundance and Spawning Escapement of Interior Fraser River Coho 1975-2015
1975 1976 1977 1978 1979 1980 1981 1982 1983 1984 1985 1986 1987 1988 1989 1990 1991 1992 1993 1994 1995 1996 1997 1998 1999 2000 2001 2002 2003 2004 2005 2006 2007 2008 2009 2010 2011 2012 2013 2014 2015
Number of Coho Spawning Escapement Total Abundance
16
400,000 350,000
17 Largest chum population in British Columbia
Escapement goal is 800,000 Return to Fraser from September through November
Major spawning areas are below Hope
, Stave
Enhancement
recent years
18 Managed based on in-season information derived from the Albion test fishery 2015 in-season assessment
–October 20th preliminary run size estimate of 1.5 million –October 22ndth run size estimate was 1.78 million
Post-season assessment (escapement)
–2015 escapement assessments are still underway – no preliminary estimates available
19
20
21 Directed chum fisheries in-river if a commercial TAC is identified
– constraints due to co-migrating stocks of concern
Area B Fraser River Chum/Pink Fisheries
– Unsuccessful pink fishery (27 pink, 5 coho, 21 chinook) – Limited Chum success, harvest of 4,513 Chum – 56 Coho released
Area E Fraser River Chum Fishery
– harvest of 125,463 chum – retained bycatch of 104 chinook, 4 hatchery marked coho and 1 steelhead – 129 Chinook, 730 coho, and 21 steelhead were released
Commercial kept rel kept rel kept rel Area E Chum directed 104 129 4 730 125,463 67 Area B Chinook Coho Chum
22
Pink Directed
4,513
23
24
Fisheries in Region 3 generally target a specific stock group and are short duration
mentioned are closed to fishing for salmon year-round. A closure to all salmon fishing was implemented on July 22 due to high water
Fisheries targeting Sp/Sum 52 stocks
–Clearwater and North Thompson Rivers catch and release July 16 to July 21, then closed, then August 7 to Aug 21, one Chinook per day from (monthly limit of 2). –Fraser River at Bridge River open Sunday through Thursday from June 16 to July 2; 1 per day
Fisheries targeting Summer 41 stocks
–Thompson River Goldpan to the Fraser Aug. 29 to Sept. 22, 4 per day, none > 50 cm –Kamloops Lake And Thompson River downstream to Goldpan Aug 28 to Sept. 22, 4 per day, 1 > 50 cm –South Thompson River Aug 22 to Sept 22, 4 per day, 2 > 50 cm
25
All fisheries in these Regions target Spring or Summer 52 Chinook One Chinook per day, none > 77 cm in the following areas and times:
–Bowron River: July 15 to Aug 15 –Cariboo and Chilko Rivers: July 25 to Aug 16 –Nechako River: Aug 15 to Aug 27 –Quesnel River: July 15 to Sept 1
These fisheries target Summer 41 Chinook with some measures in place to avoid Bessette Spring 42 stocks. Areas not specifically mentioned are closed to fishing for salmon year round. Fisheries were reduced this year due to high water temps. – Mabel Lake and Lower Shuswap River opened to Chinook Sept. 1 to Sept 13 , 4/day,
area that remained closed near the mouth of the Middle Shuswap River due to concerns for Middle Shuswap chinook.
26
Closure” from early September to early October
Mission)
Nicomen Slough and Chilliwack/Vedder Rivers.
Recreational kept 11,824 3,342 rel 1,658 412 kept 23
kept 123
Lower Fraser BC Interior 35 111
Coho Chum
27
28
Chinook-directed fisheries
Lower Fraser –Open, with reduced fishing time, every second weekend for most groups from April 4 through August 1 –managed to reduced hours to maintain effort consistent with Zone 2 management Mid Fraser –limited Chinook 8-inch mesh in a few areas starting late April and directed Chinook with selective gear began June –Chinook fisheries with sockeye non-retention occurred from July 1 to 29 Thompson River Upstream of Bonaparte –licensed July 15 for Chinook/sockeye Upper Fraser –directed Chinook fisheries began June 1 with selective gear including angling and dip net –sockeye non-retention fisheries occurred during the Early Stuart closure with selective gear, including 8” mesh gillnets
29
Sockeye-directed fisheries
Lower Fraser
– dry rack fisheries August 2 to 13 – Only one FSC opening from August 6 to Aug 9
Mid Fraser
– sockeye/Chinook fisheries took place from July 30 to October 20
Upper Fraser
– Deadman to Hixon: directed sockeye fishing with dipnets initiated Aug 4 – Upstream of Hixon: directed gillnet fishing initiated Aug 8 – limited retention in July in terminal areas with access to only Early Stuart
Coho-directed fisheries
30 Pink-directed fisheries
Lower Fraser
closure
Chum-directed fisheries (Lower Fraser only)
– FSC openings on weekends from Oct 10 to Nov 29
31
Lower Fraser River Economic Opportunity Fisheries
–No targeted sockeye salmon in 2015 –Targeted pink and chum salmon in 2015 Pink-directed fisheries occurred between September 22 – 25 –Sts’ailes targeting their own allocation plus, Tsawwassen, UFFCA and SFC allocations. –38,539 pink retained from combined allocation of 39,600 pink –233 coho and 484 sockeye released Chum-directed fisheries occurred between Oct 22 and Nov 6 –122,309 chum retained –bycatch of 526 coho, 22 chinook and 1 steelhead retained –2,867 coho, 644 Chinook, and 21 steelhead released
32
Secwepemc Fisheries Commission –South Thompson 41 Chinook on Kamloops Lake –Chinook 8 inch gillnet. Harvest was 2,493 chinook –bycatch mortalities of 1 coho and 554 Sockeye kept –Allocation of 3,100 Chinook for 2015 Upper Fraser Conservation Alliance –No fishery occurred in 2015 ( No sockeye CCTAC)
33
Coho retention was permitted in all FSC fisheries in 2015.
Fraser River First Nations kept rel kept rel kept rel FSC Lower Fraser 20,373 73 329 118 36,273 59 BC Interior 3,339 90 55
Lower Fraser 22 1,481 526 2,867 122,309 600 BC Interior (Demo) 2,493
Lower Fraser 8,752
Lower Fraser 29,147 1,554 12,139 2,985 174,248 659 BC Interior 5,832 90 55
34,979 1,644 12,194 2,985 174,248 659 Chinook Coho Chum
34
35
suggested there is lower than a 50% probability of achieving the short term conservation objective of 20,000 spawners (3-year geometric mean).
River coho) is to limit the Canadian exploitation rate to 10% or less for the 2015 season only.
36
Pre-season and In-season Assessment of fishery impacts:
models that integrate assumptions about anticipated coho encounters, fishing effort levels, estimates of proportion of Interior Fraser River coho stocks within the total encounters based
Cape Caution
37
2016
mentioned previously but using any actual information on encounter rates (kept and released) and fishing effort collected during the fishing season.
38
39
August 12, 2015 at which time sockeye non-retention in FSC fisheries
still minimal
40
Numbers Kept Commercial Area H Troll Fraser Sockeye (12,13) Area H Troll JST Chum (12,13) 24 Area H Troll MVI Chum (14) Area B Seine Fraser Sockeye (12,13) Area B Seine Fraser Sockeye (16) Area B Seine Mainland Pink (12, 16) 95,198 Area B Seine JST Chum (12,13) 145 Area B Seine MVI Chum (14-19) Area D Gillnet Fraser Sockeye (11,12,13,14) Area D Gillnet JST Chum (12,13) 114 Area D Gillnet MVI Chum (14) Area E Gillnet MVI Chum (Area 14-19) Total Commercial Catch 95,481 Fishery Gear Fishery (Area)
41
Numbers Kept Commercial Area H Troll Fraser Sockeye (12,13) Area H Troll JST Chum (12,13) 48,544 Area H Troll MVI Chum (14) 2 Area B Seine Fraser Sockeye (12,13) Area B Seine Fraser Sockeye (16) Area B Seine Mainland Pink (12,16) Area B Seine JST Chum (12,13) 352,502 Area B Seine MVI Chum (14-19) 183,033 Area D Gillnet Fraser Sockeye (11,12,13,14) Area D Gillnet JST Chum (12,13) 91,795 Area D Gillnet MVI Chum (14) 12,812 Area E Gillnet MVI Chum (Area 14-19) 40,250 Total Commercial Catch 728,938 Fishery Gear Fishery (Area)
42
Chinook
required.
than typical chinook non-retention timing. Coho
were in place in recreational fisheries in 2014.
Oct 1-Dec 31.
Sockeye
Pink
ECVI, especially JDF. Chum
and catches in marine fisheries.
43
Fishing Area Sockeye Kept Sockeye Released Coho Kept Coho Released Pink Pink Chum Chum Released Chinook Chinook Chinook Chinook Kept Released Kept ISBM Kept ISBM Released AABM Kept AABM Released Juan de Fuca (19,20) 212 1,323 11,083 25,811 58,104 63,845 162 6 30,558 20,913
84 2,991 7,216 27,562 28,155 17,832 1,721 50 51,483 36,655
14 100 8,600 4,833 6,606 7,185 59 31 12,127 9,138
94,364 646 18,091 11,932 3,551 8,998 30
14,877 7,215 4,051 WCVI - Offshore (121-127) 225 63 7,716 17,699 2,533 9,203 49 7
24,279 Fraser River 37 4,169 23 35 12,266 19,746 55 17 13,186 1,702
94,936 9,292 52,729 87,872 111,215 126,809 2,076 111 139,107 83,285 48,775 28,330
44
Sockeye Kept Coho Kept Pink Kept Chum Kept Chinook ISBM Kept AABM Kept 39,394 1,917 5 2,246 2,019 3,946
45
Pre-Season and Post-Season Total Allowable and Preliminary Catch Estimates for October 2014-September 2015 WCVI AABM Chinook
Pre-Season Post-Season WCVI AABM Abundance Index 0.85 under review WCVI AABM chinook TAC* 127,278 under review AABM Sport Catch 60,000 48,775 First Nations Catch (FSC) 5,000 996** Maa-nulth First Nations Catch (FSC) 4,141 2,400** T’aaq-wiihak Catch 7,267 6,234 Area G Troll Catch 50,870* 54,338 Total AABM Catch 127,278 113,293 *The total Area G troll TAC is calculated as the difference between the WCVI AABM chinook TAC less
wiihak allocation. **First Nations catch is preliminary.
46
Month-Year Retained Released Retained Released
Oct-14
10,422 9
Nov-14 Dec-14 Jan-15
1
Feb-15 Mar-15 Apr-15
2
May-15
808
Jun-15 Jul-15
1,161
Aug-15
23 1,011 519
Sep-15
6,055 53 574 48 Total 16,501 1,883 574 1,728 Area G T'aaq-wiihak
Coho Bycatch
47
48
49
50
Kept Rel. Kept Rel. Kept Rel. Kept Rel. Juan de Fuca (19,20) 212 1,323 11,083 25,811 58,104 63,845 162 6 WCVI - Inshore (20W-27) 88,232 646 18,091 11,932 3,551 8,998 30
(121-127) 225 63 7,716 17,699 2,533 9,203 49 7 Sockeye Coho Pink Chum Fishing Area
51