
SLIDE 1
1
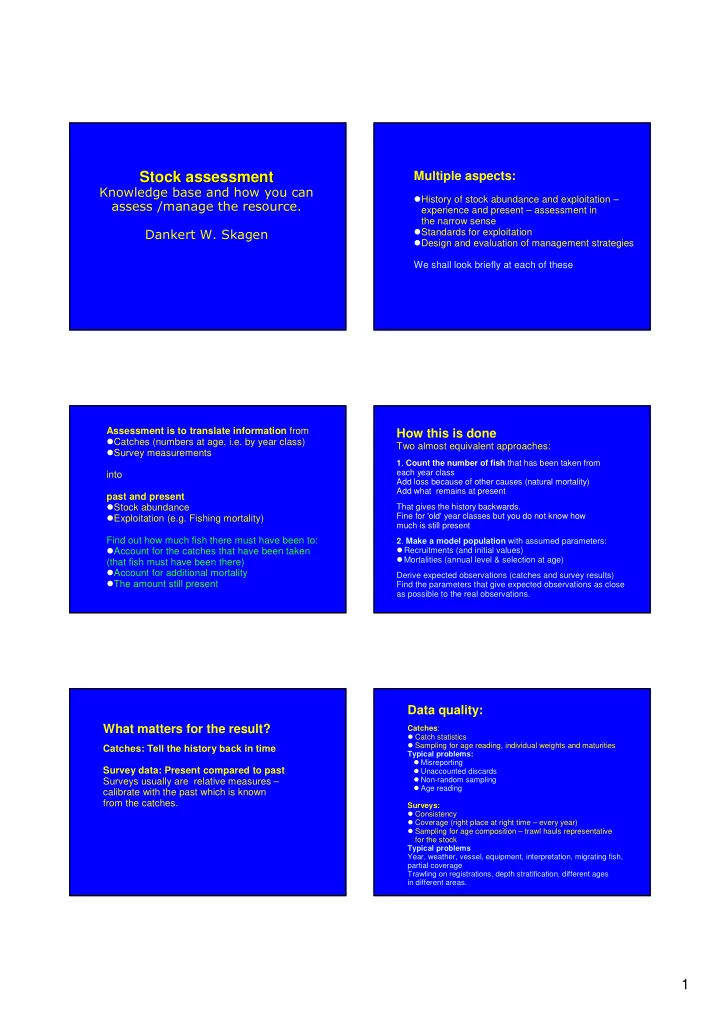
Stock assessment Stock assessment
K
- Multiple aspects:
History of stock abundance and exploitation – experience and present – assessment in the narrow sense Standards for exploitation Design and evaluation of management strategies We shall look briefly at each of these Assessment is to translate information from Catches (numbers at age, i.e. by year class) Survey measurements into past and present Stock abundance Exploitation (e.g. Fishing mortality) Find out how much fish there must have been to: Account for the catches that have been taken (that fish must have been there) Account for additional mortality The amount still present
How this is done
Two almost equivalent approaches:
- 1. Count the number of fish that has been taken from
each year class Add loss because of other causes (natural mortality) Add what remains at present That gives the history backwards. Fine for 'old' year classes but you do not know how much is still present
- 2. Make a model population with assumed parameters: