SLIDE 1
The Role of Agriculture in Development Policy EESC 11.06.2015 External Relations Section & Farmers’ Category Agriculture and Development, main challenges
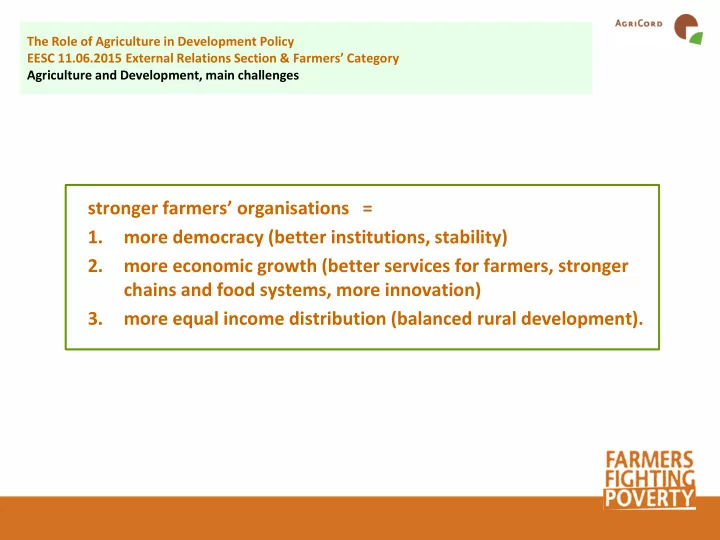
stronger farmers’ organisations = 1. more democracy (better institutions, stability) 2. more economic growth (better services for farmers, stronger chains and food systems, more innovation) 3. more equal income distribution (balanced rural development).
SLIDE 2
Members
Farmers’ organisations
Country Since ACODEA AFDI UPA, FADEMUR, Cooperativas Agro-Alimentarias FNSEA, APCA, Jeunes Agriculteurs, CNMCCA Spain France 2014 2003 AGRITERRA AHA LTO, SSVO, NCR and NAJK DBV Deutscher BauernVerband Netherlands Germany 2003 2014 ASIADHRRA AFA Asian Farmers Association for Sustainable Rural Development Asia 2011 ASPRODEB Organisations agricoles du Sénégal membres d’Asprodeb Senegal 2011 CSA FWA Fédération Wallonne d’Agriculture Belgium 2010 FERT Groupe Céréaliers de France (AGPB, AGPM, ARVALIS, UNIGRAINS) France 2003 FFD MTK, SLC, Pellervo, ProAgria Finland 2013 TRIAS Boerenbond, Landelijke Gilden, KVLV and KLJ Belgium 2003 UPA DI UPA Union Professionnelle Agricole (Québec) Canada 2003 WE EFFECT LRF Federation of Swedish Farmers Sweden 2004 Associated member CIA Confederazione Italiana Agricoltori Italy 2009
SLIDE 3
AgriCord = focus on one actor membership based organisations of family farmers
Table 1.1 Numbers of farmers’ organisations and projects registered under FFP, by region, 2012- 2014 Continent Farmers' organisations Projects 2012 2013 2014 2012 2013 2014 Africa 119 127 131 142 160 161 Asia 30 31 39 33 37 51 Europe 6 7 8 6 8 8 Latin America/Caribbean 33 31 27 36 35 32 Total 188 196 205 217 240 252
SLIDE 4
Outreach = number of man and women farmers directly participating in project activities
Table 1.10 Registered outreach for 2013 for each work area Work area Registered WA1: Organisational strength and inclusiveness 223,090 31.4% WA2: Institutional development 1,433 0.2% WA3: Policy elaboration and advocacy 53,557 7.5% WA4: Farmer-led economic activities 431,469 60.8% Total 709,549 100.0%
SLIDE 5
Monitoring of strengthening processes: 17 deliverables, with measurable targets
Del.01-5 (5) Membership base (222 registrations) The FO has an active and representative membership, mandated by and structurally aligned with well functioning local basic groups with increased membership base.
Target # Planned Realised Local groups established (number) 124 24,658 25,610 104% Number of primary coops (number) 46 1,042 1,012 97% Increased membership (m/f/t) 36 414,841 410,123 99% Good quality groups (%) 8 52% 55% 105% Local groups represented (y/n) 4 4 4 100% Members satisfied with services (%) 4 85% 61% 72% Total 222 101%
SLIDE 6
Monitoring of strengthening processes: 17 deliverables, with measurable targets
Del.04-4 (16) Marketing (198 registrations) The FO leads collective action to improve product marketing (better conditions including price, timely marketing, more value added and shorter chain) to increase the market power of family farmers and to achieve higher incomes.
Target # Planned Realised Business plan to improve marketing (y/n) 58 37 28 76% Number of linkages with market outlet (number) 47 970 962 99% Chain analysis for key product (y/n) 41 31 26 84% Access to market information (y/n) 38 28 21 75% Local groups with increased market volume (y/n) 7 4 3 75% Local groups with trade contracts / deals (number) 5 30 29 97% Local groups in agribusiness clusters (number) 2 5 0% Total 198 83%
SLIDE 7 support to farmers’ organisations is effective [ impact and outreach ] support to farmers’ organisations is efficient [ key competences ]
- 1. NETWORKING
- 2. PARTICIPATION
3. ACCOUNTABILITY
CAPACITY
- 5. RESULTS
- 6. INCLUSIVENESS
General averages
2009 2014
SLIDE 8 Competence Leading indicator Meaning
- 1. Representativity
- 1. Representativity indicator
Is the organisation a representative organisation, with a significant proportion of farmers in its membership?
- 2. Participation
- 2. Participation indicator
Does the organisation involve its members?
- 3. Accountability
- 3. Accountability indicator
Does it report back to its members?
- 4. Inclusiveness
- 4. Diversity indicator
Does it involve women and youth?
- 5. Professionalism
- 5. Professional capacity indicator
Is it a professional organisation?
- 6. Financial Sustainability
- 6. Income diversification indicator
Does it obtain income from other sources than donors?
- 7. Financial solidity indicator
What is the financial sustainability of the organisation?
- 7. Networking
- 8. Networking indicator
Does it relate to other actors? 9 Results indicator Does it provide useful services?
SLIDE 9 how ? (1)
- peer-to-peer support between
professional organisations
- strong focus on food chain
development, incl. contract farming, innovation
- demand-driven by membership-
based farmers’ organisations and cooperatives. how ? (2)
- ensure complementarities with
public programs, synergies with government
- mobilise investments from
banks and private sector, using grant funding
- promote family farming and
rural entrepreneurship.
SLIDE 10