
SLIDE 1
1 !
Stellar Populations of Galaxies-"
2 Lectures "
see MBW10.3- ( sec 10.1-10.2 for stellar structure theory- will not cover this) parts of sec
2.2 and 6.3 in S&G!
Top level summary!
- stars with M<0.9M! have
MS lifetimes >tHubble!
- M>10M! are short-
lived:<108years ~1torbit!
- Only massive stars are
hot enough to produce HI–ionizing radiation !!
- massive stars dominate
the luminosity of a young SSP (simple stellar population)!
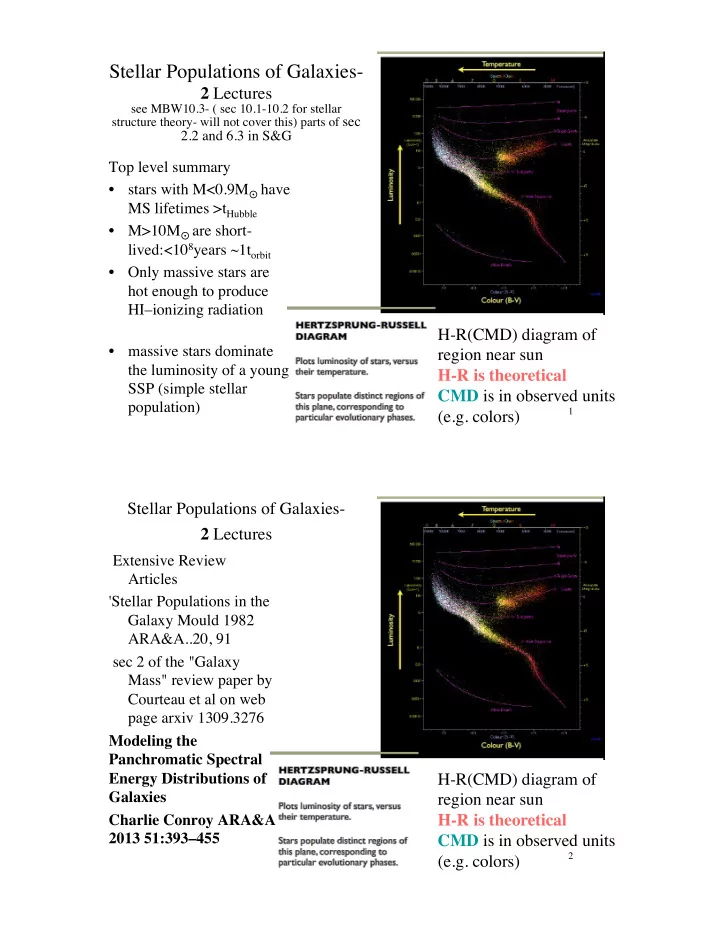
H-R(CMD) diagram of! region near sun! H-R is theoretical! CMD is in observed units! (e.g. colors)!
2 !