10/16/2018 County Judges and Commissioners Association of Texas - - PDF document

10 16 2018
SMART_READER_LITE
LIVE PREVIEW

10/16/2018 County Judges and Commissioners Association of Texas - - PDF document

10/16/2018 County Judges and Commissioners Association of Texas Trent Thomas Thomas, TxDO TxDOT T Dire Direct ctor of of Stat State Le Legislati gislative A e Affairs irs Texas Department of Transportation October 11, 2018 TxDOTs


slide-1
SLIDE 1

10/16/2018 1

Texas Department of Transportation October 11, 2018

Trent Thomas Thomas, TxDO TxDOT T Dire Direct ctor of

  • f Stat

State Le Legislati gislative A e Affairs irs

County Judges and Commissioners Association of Texas

Texas Department of Transportation October 11, 2018

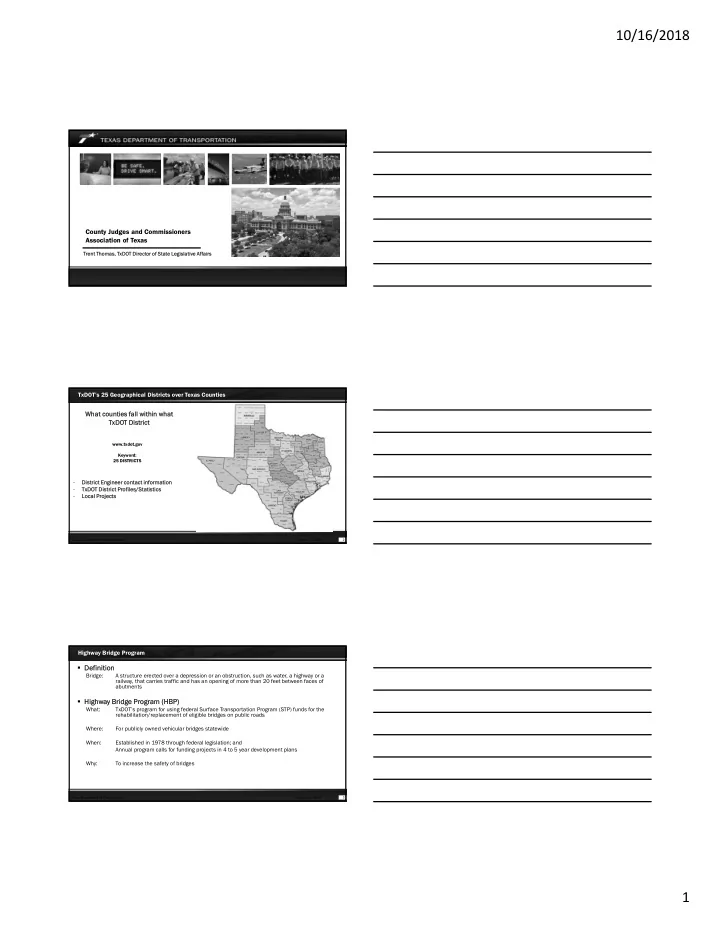
TxDOT’s 25 Geographical Districts over Texas Counties

2

What count What counties es f fall within what within what TxDO DOT District T District

www.txdot.gov Keyword: 25 DISTRICTS

  • Distri

rict E ct Engineer contact i t informa rmatio ion

  • TxDO

DOT D Distric rict Profile iles/Sta tatist tistics ics

  • Lo

Local cal Pr Projects ts

Texas Department of Transportation October 11, 2018

Highway Bridge Program

3

  • Def

Definition

Bridge: A structure erected over a depression or an obstruction, such as water, a highway or a railway, that carries traffic and has an opening of more than 20 feet between faces of abutments

  • High

Highway Brid Bridge Pr Progr

  • gram (HBP

(HBP)

What: TxDOT’s program for using federal Surface Transportation Program (STP) funds for the rehabilitation/replacement of eligible bridges on public roads Where: For publicly owned vehicular bridges statewide When: Established in 1978 through federal legislation; and Annual program calls for funding projects in 4 to 5 year development plans Why: To increase the safety of bridges

slide-2
SLIDE 2

10/16/2018 2

Texas Department of Transportation October 11, 2018

Highway Bridge Program

4

Lo Local F Fund nding Alt ing Altern rnati atives es

  • Payment match
  • Full 10%
  • Economically Disadvantage County Program

(EDC)

  • State Infrastructure Bank (SIB)
  • Other
  • Participation Waived Project / Equivalent

Match Project program (PWP/EMP)

  • State provides up to the 10% match

contribution

  • Local Government performs bridge / low

water crossing safety improvements

  • Fiscally constrained to $280 million per

fiscal year (FY)

  • $60 million – Off-system
  • $220 million – On-system
  • Federal funds require a participation

match of 20%

Fu Funding

Of Off-System Pr Projects ($) ($) 80% - Federal 10% - State 10% - Local On On-Sys ystem Pr Projects ($) ($) 80% - Federal 20% - State

Texas Department of Transportation October 11, 2018

Local Government Assistance Program

5

Established 1997, Texas Transportation Code §201.706

  • Requires $6,000,000 worth of materials to be

given each year to counties

  • Assist in repairing/maintaining county roads

impacted by 2060 Weight Tolerance permits

  • Program Allocation Method (Statewide)
  • 65% based on county’s percentage of Weight

Tolerance permits

  • 20% based on county’s percentage county road

vehicle miles

  • 15% based on county’s percentage lane miles of

county roads

Texas Department of Transportation October 11, 2018

Public Transportation – Urban/Rural Transit District

6

  • $85 - $100 million per year in federal and state

grant program funds

  • $20.1 million to 37 Rural Transit Districts
  • Supports programs serving 41% of the state’s

population and over 97% of the state’s land area

  • Over 30 million one-way passenger trips/year
  • Over 50% of rural program ridership is healthcare-

related

  • 25% - 30% of rural program ridership is work-

related

  • Formula combines population, land use,

performance

  • Funds may be used for operating, capital, and

administrative purposes

slide-3
SLIDE 3

10/16/2018 3

Texas Department of Transportation October 11, 2018 7

General Aviation – Infrastructure Development/Maintenance

TxDOT Aviation Division Supports 278 General Aviation Airports By Partnering with Political Subdivisions to Fund Airport Improvement Projects Invests approximately $4M

$4M annually to

maintain and protect prior investments in airport development.

  • 50/5

50/50 Cost Share

  • Maximum annual grant—$50,000

Airp rpor

  • rt F

t Facilities cilities De Developm velopmen ent Program t Program Invests approx. $70M

$70M in state and federal grant

funding annually to improve airports owned by political subdivisions; primarily counties and cities.

  • Airfield Pavement rehab, reconstruction and construction;

Lighting; Navigation Aids; Drainage; Fencing; and Planning Studies.

90/1 90/10 Cost Share

  • Hangar and Air Traffic Control Tower construction;

90/1 90/10 Cost Share

  • Fuel Systems and Automated Weather Observation Systems

75/ 75/25 Cost Share

  • Terminal Building construction

50/ 50/50 Cost Share www.txdot.gov Keyword: Aviation

Routine utine A Airpor

  • rt M

t Mainte intena nanc nce (R e (RAMP) P)

Texas Department of Transportation October 11, 2018

SB 1747 (83R) - County Transportation Infrastructure Fund Grant Program (CTIF)

8

  • $224.5 million to 191 counties that applied
  • The following formula determines the allocation:
  • 20% – weight tolerance permits
  • 20% – oil and gas production taxes
  • 50% – well completions
  • 10% – volume of oil and gas waste injected

Data provided by TxDMV, Comptroller’s Office and the Railroad Commission.

  • $213.3 Reimbursed (As of October 5, 2018)
  • 167 counties completed CTIF projects
  • Appropriation expires FY 2021

Texas Department of Transportation October 11, 2018

Texas Trunk System

9

The Trunk System is a network of rural divided highways that complements and includes elements of the Interstate Highway System

  • Led by Texas Transportation Commissioner Alvin New
  • Emphasis Areas:
  • 1. Connectivity
  • 2. Safety
  • 3. Economic Development
  • 4. Congestion Relief
  • Texas Transportation Commission Workshop (Austin) (December)
  • Stakeholder Meetings (January – March 2019)
  • Amarillo
  • Lampasas
  • Lufkin
  • San Angelo
  • Tyler
  • Victoria

DRAFT

slide-4
SLIDE 4

10/16/2018 4

Texas Department of Transportation October 11, 2018

Project Tracker

10 Texas Department of Transportation October 11, 2018

Project Tracker

11 Texas Department of Transportation October 11, 2018 12

3,724 189 November 7, 2000 62,553

2017 Fatalities 2017 Work Zone Fatalities Last deathless day in Texas Deaths since November 7, 2000

Safety

slide-5
SLIDE 5

10/16/2018 5

Texas Department of Transportation October 11, 2018

Fatal Accidents in Texas

13

  • Heat map of fatalities 2016-2018 (to-date)
  • Fatal Crashes on two lane or four lane roads

with reported speed limits of 75 MPH or greater

  • Can be attributed to:
  • Driving Under the Influence
  • Distracted Driving
  • Drowsy Driving
  • No Seat Belts

An alarming statistic is that while we have 92% seatbelt usage in Texas, 40% of fatalities had unrestrained occupants

Texas Department of Transportation October 11, 2018

In Closing

14

1. Communicate with District Engineer on a regular basis 2. Learn about these programs TxDOT has to offer 3. Discuss, teach and lead by example on Safety