
SLIDE 1
1
1 Why ELSS? Deduction U/s 80C Deduction can be claimed by - - PowerPoint PPT Presentation
1 Why ELSS? Deduction U/s 80C Deduction can be claimed by investing in ELSS funds along with other prescribed investments u/s 80C upto Rs 1,50,000/- Exposure to equities with a long term horizon 3 Year lock in ensures money
1
– Deduction can be claimed by investing in ELSS funds along with other prescribed investments u/s 80C upto Rs 1,50,000/-
2 Investors should be aware that the fiscal rules/ tax laws may change and there can be no guarantee that the current tax position may continue indefinitely. HDFC Mutual Fund/AMC is not guaranteeing returns on investments made in this scheme. In view of individual nature of tax consequences, each investor is advised to consult his/her own professional tax advisor.
Assume Gross Total Income for the year is
Investment in HDFC TaxSaver
Income on which tax will be paid
Tax Saved on Rs. 1,50,000/-
The following example illustrates Tax Saving:
* Calculated for individuals in the highest tax bracket, having taxable income up to Rs. 50 lakh.
Investors can avail benefit of Rs. 46,800 under Section 80C* by investing in ELSS on day one of investments. This is apart from the returns ELSS could possibly earn
As on January 31, 2020: *Source: MFI Explorer. The largest 15 open-ended ELSS Schemes in terms of asset under management have been considered in calculating the average.
3 HDFC Mutual Fund/AMC is not guaranteeing returns on investments made in this scheme. The current investment strategy is subject to change depending on the market conditions. Please refer Scheme Information Document for further details. Please refer the website www.hdfcfund.com for complete portfolio details. Scheme Name Large Cap (%) Mid Cap (%) Small Cap (%) HDFC Tax Saver (G) 82.25 8.12 4.05 Average of the 15 largest ELSS schemes* 65.78 20.67 10.24
Exposure
4
Data is as on 31 January, 2020 For complete portfolio, please refer www.hdfcfund.com Stocks/sectors referred above are not recommended by HDFC Mutual Fund/AMC. The Fund may or may not have any present or future positions in these stocks/sectors. The above statements / analysis should not be construed as an investment advice or a research report or a recommendation to buy or sell any security covered under the respective sector/s.
5 Data is as on January 31, 2020 For complete portfolio, please refer www.hdfcfund.com *The average sector allocation of the 15 largest open ended ELSS schemes in terms of assets under management as on January 31, 2020 have been considered. Stocks/sectors referred above are not recommended by HDFC Mutual Fund/AMC. The Fund may or may not have any present or future positions in these stocks/sectors. The above statements / analysis should not be construed as an investment advice or a research report or a recommendation to buy or sell any security covered under the respective sector/s.
Sector % Allocation HDFC TaxSaver NIFTY 500 (Benchmark) Peers* Utilities 15.57 5.33 2.98 Corporate Bank & Financials 20.13 14.08 10.24 Industrials 13.06 11.02 6.71 Energy 13.01 6.84 9.03 Real Estate
0.77 Communication Services 1.87 3.71 2.79 Other Financial Services
2.78 Information Technology 8.62 8.41 10.15 Materials 6.30 9.45 8.29 Health Care 3.46 6.62 4.76 Consumer Staples 3.96 5.87 9.34 Consumer Discretionary 1.73 11.31 8.85 Retail Bank & Financials 7.95 14.95 23.30 Major Overweight Sectors Major Underweight Sectors
Sector Portfolio Weight vis a vis Benchmark Rationale Corporate Banks & Financials Overweight The recognition phase of NPAs is largely over; with falling slippages and increasing resolution of NPAs, provisioning costs are expected to fall sharply. Utilities Overweight Change in CERC (Central Electricity Regulatory Commission) regulations; capacity - led growth; very attractive valuations versus history. Energy Overweight Increase in tariffs and more to come for the larger gas transmission companies; positive
low expectations Industrials Overweight Massive infrastructure spending thrust announced by Government of India; order books remain strong for most companies in the sector; resolution of IBC cases in core sector will aid capex cycle. Retail Banks & Financials Underweight Underweight on NBFCs due to an inherently risky business model and high valuations Information Technology Underweight Revenue growth trajectory is slowing down; disruption from new technologies has shifted the spend to Digital and increased pricing pressure in traditional areas of spend. Margins are also under pressure. Health Care Underweight Adverse action from US FDA has resulted in uncertainty. Growth in India business has continued, albeit a lower pace; R&D expenses are also increasing and margins are under pressure. Consumer Discretionary Underweight Auto sector is facing multiple headwinds. The transition to BSVI will lead to higher vehicle prices and is a near term headwind. EVs are likely to emerge as a threat in 3Ws followed by 2Ws over the next few years. Non auto consumer durable companies face headwinds such as lower demand and increased competition leading to lower margins.
6
Stocks/sectors referred above are not recommended by HDFC Mutual Fund/AMC. The Fund may or may not have any present or future positions in these sectors. The above should not be construed as an investment advice or a research report or a recommendation by HDFC Mutual Fund/HDFC AMC to buy or sell the stock or any other security covered under the respective sector/s. The above has been prepared on the basis of information which is already available in publicly accessible media and includes views of HDFC AMC. The recipient should understand that the information provided above may not contain all the material aspects relevant for making an investment decision. For complete portfolio details refer www.hdfcfund.com. The portfolio weights (Slide 5) used are as on January 31, 2020.
Source: Bloomberg
Overweight sectors Underweight Sectors
Stocks/sectors referred above are illustrative and are not recommended by HDFC Mutual Fund/AMC. The Fund may or may not have any present or future positions in these stocks/sectors. The above statements / analysis should not be construed as an investment advice or a research report or a recommendation to buy or sell any security covered under the respective sector/s .The same has been prepared on the basis of information which is already available in publicly accessible media.
8
0.6 0.8 1 1.2 1.4 1.6 1.8 Jan-11 Jan-12 Jan-13 Jan-14 Jan-15 Jan-16 Jan-17 Jan-18 Jan-19 Jan-20
Rolling 12-months P/B Ratio (Forward book value) 10 12 14 16 18 20 22 24 Jan-11 Jan-12 Jan-13 Jan-14 Jan-15 Jan-16 Jan-17 Jan-18 Jan-19 Jan-20
Rolling 12 months PE Ratio (Bloomberg consensus estimates) 10 12 14 16 18 20 22 Jan-13 Jan-14 Jan-15 Jan-16 Jan-17 Jan-18 Jan-19 Jan-20
Rolling 12-month PE Ratio (Bloomberg consensus estimates) 20 23 26 29 32 35 38 41 Jan-11 Jan-12 Jan-13 Jan-14 Jan-15 Jan-16 Jan-17 Jan-18 Jan-19 Jan-20
Rolling 12-month PE Ratio (Bloomberg consensus estimates)
How an annual investment of Rs. 1,00,000 in March every year since 1996 would have performed up to January 31, 2020
Past performance may or may not be sustained in future. Source: Bloomberg and other publicly available information. The above simulation is for illustration purpose only. Year end balance has been arrived at by adding interest at the rates notified by the Competent authorities from time to time. # Benchmark Index of HDFC TaxSaver. $$ All dividends declared prior to the splitting of the Scheme into Dividend & Growth Options are assumed to be reinvested in the units of the Scheme at the then prevailing NAV (ex-dividend NAV). Unlike PPF, investments in Mutual Funds are subject to market risks. Hence, the performances are not strictly comparable. As Nifty 500 TRI data is not available for March 31, 96, benchmark performance is calculated from March 29, 96 For complete performance, please refer slide 18.
8
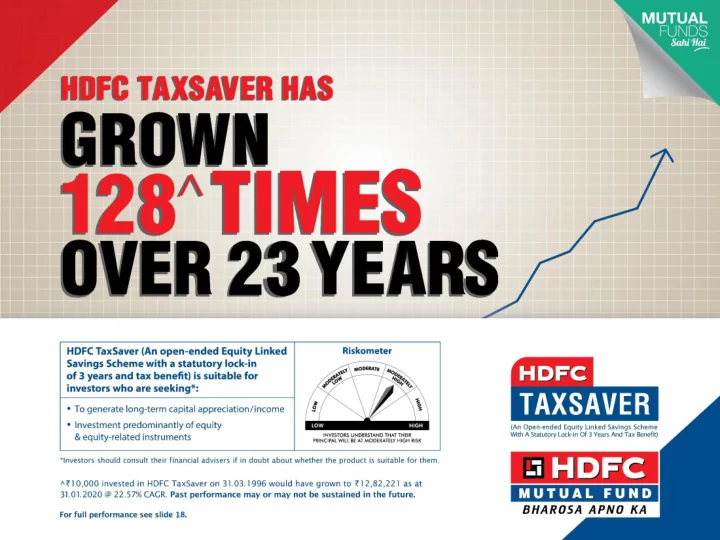
Annual investment of Rs 1,00,000 in March every year since 1996 in HDFC Tax Saver would have resulted in an investment value of Rs. 5.99 crore in 2019. Similar investment in PPF would have resulted in an investment value of Rs. 75.94 lakh
9
Source: Bloomberg, HDFC AMC. Data as of January 31, 2020. All Values rebased to Rs 10 from date of inception of HDFC TaxSaver, i.e., 31st March 1996. Past performance may or may not be sustained in future. Refer Slide No. 18 for detailed performance. The above returns are of Regular plan - growth option. $$All dividends declared prior to the splitting of the Scheme into Dividend & Growth Options are assumed to be reinvested in the units of the Scheme at the then prevailing NAV (ex-dividend NAV). The performance of the Scheme is benchmarked to the Total Return Index (TRI). As Nifty 500 TRI data is not available for March 31, 96, benchmark performance is calculated from March 29, 96.
1,282.22$$ 178.2
200 400 600 800 1,000 1,200 1,400 1,600
HDFC Tax Saver Fund NIFTY 500 TRI
10 Past performance may or may not be sustained in the future. All dividends are on face value of Rs. 10 per unit. After payment of the dividend, the per Unit NAV falls to the extent of the payout and statutory levy (if applicable.). There is no assurance or guarantee to unit holders as to the rate/quantum of dividend distribution nor that the dividends will be paid regularly. For complete dividend history details visit www.hdfcfund.com
Record Date 1999 1999 2000 2001 2002 2003 2004 2004 2005 2006 2007 2008 Per Unit (Rs.) 3.6 5 21 1.6 2 2 2 2 5 7.5 7.5 8 Record Date NAV (Rs.) 25.7 35.4 41.6 15.7 17.9 19.9 28.4 26.7 40.6 67.1 60.4 66.1 Dividend Yield (%) 14% 14% 51% 10% 11% 10% 7% 8% 12% 11% 12% 12% Record Date 2009 2010 2011 2012 2013 2014 2015 2016 2017 2018 2019 Per Unit (Rs.) 5 6 6 6 6 6 7 6 6.5 7 6 Record Date NAV (Rs.) 31.2 61.9 62.7 56.7 53.6 52.7 73.7 53.6 66.4 66.6 59.5 Dividend Yield (%) 16% 10% 10% 11% 11% 11% 10% 11% 10% 11% 10%
same rate as the nominal GDP ‒ This implies that when in any extended period of, say 10 years, indices grow significantly less than nominal GDP, they tend to make up in the future by delivering higher returns & vice versa. Interestingly, we are in a similar situation presently (Table 1)
at time when NIFTY50 profit growth is estimated at 18% CAGR over FY19- 22E and interest rates are low
/ (one year forward P/E)] has reduced significantly and is now below 10 year average (1.7%) indicating that equities are attractively valued relative to current bond yields
India market cap to GDP ratio, calendar year-ends 2005-21E (%)
Low Marketcap to GDP, Bond yields equal to Earnings yield and recovery in profit growth make us optimistic on markets over medium to long term 11
2.0 6.0 10.0 14.0 06 07 08 09 10 11 12 13 14 15 16 17 18 19 10Y Gsec and NIFTY Earning Yield near equal
Yield gap (%) Earnings yields (%) India 10-y G-Sec yields (%) 69 88 149 56 99 98 61 72 65 81 75 71 92 78 75 67 61 13 15 23 11 17 16 13 14 16 20 18 17 19 17 22 18 15
5 9 13 17 21 25 30 50 70 90 110 130 150 170 05 06 07 08 09 10 11 12 13 14 15 16 17 1819E 20E 21E Mcap/GDP (%) NIFTY 12M forward P/E (X) (RHS) Year Trailing 10 year NIFTY Return (CAGR) Trailing Nominal GDP Growth (10 year CAGR) Next 10 year NIFTY Return (CAGR) 2001 7% 13% 16% 2002 4% 13% 18% 2003 6% 12% 13% 2004 6% 12% 15% 2006 16% 12% 8% 2007 19% 12% 6% 2016 8% 14% ? 2017 6% 13% ? 2018 14% 13% ? 2019 9% 13% ? Table 1 – Periods when10 year NIFTY Return trailed / exceeded Nominal GDP Growth materially
Source: Kotak Institutional Equities, updated till 30th Nov, 2019, From 2005-18, NIFTY50 PE is based on 12 month forward estimated EPS. For 2019E, by Kotak Institutional Equities has calculated PE based on EPS numbers as of Mar-20 end, 2020E based on EPS of Mar-21 end and for 2021E based on EPS of Mar-22 end
12 Source : CMIE, CEIC, Morgan Stanley Research Refer disclaimers at the end of the presentation
India’s Corporate Profit to GDP ratio has declined from 7.1% to 2.6% - a 15 year low
HDFC Mutual Fund/AMC is not guaranteeing returns on investments made in this scheme. The current investment strategy is subject to change depending on the market conditions. Please refer Scheme Information Document for further details. Please refer to the website www.hdfcfund.com for complete portfolio details.
elusive
led almost entirely by falling profits in Corporate Banks (Table 1). Share of Corporate Banks in NIFTY 50 profits fell from 12% to 3% between FY13 & FY19 (Table 2)
expected by FY22E as slippages and provision costs are falling and recoveries are increasing. NIFTY profit growth of 18% CAGR is expected between FY19 and FY22E led by recovery in profitability of Corporate Banks
13
Source: Kotak Institutional Equities, E- Kotak Institutional Equities Estimates as on 20th December, 2019 Profit after Tax (Rs crs) CAGR % FY13 FY19 FY22E FY13-19 FY19-22E NIFTY 50 ex Corporate Banks 213,301 361,710 511,054 9% 12% Corporate Banks 28,911 10,622 93,683
107% NIFTY 50 242,212 372,332 604,737 7% 18%
1% 6% 11% 16%
RoE of Corporate Banks
0% 5% 10% 15% GNPL of Corporate Banks Slippagesof Corporate Banks Sector contribution to NIFTY 50 profits (%) FY13 FY19 FY22E Consumer Discretionary 10 7 6 Consumer Staples 5 6 6 Corporate Banks & Financials 12 3 15 Energy 29 30 22 Information Technology 15 19 15 Materials 8 11 9 Retail Banks & Financials 7 13 15 Others 15 13 12 Total 100 100 100 Table 1 Table 2
Past performance may or may not be sustained in the future. Refer slide 18 for complete scheme performance. Stocks/sectors referred above are not recommended by HDFC Mutual Fund/AMC. The Fund may or may not have any present or future positions in these
the stock or any other security covered under the respective sector/s. HDFC Mutual Fund/AMC is not guaranteeing returns on investments made in this scheme. Investors should be aware that the fiscal rules/ tax laws may change and there can be no guarantee that the current tax position may continue indefinitely. In view of individual nature of tax consequences, each investor is advised to consult his/her own professional tax advisor. Unlike other traditional tax saving instruments, investments in Mutual Funds are subject to market risks. Hence, their returns are not strictly comparable. 14
Type of Scheme An Open-ended Equity Linked Savings Scheme with a statutory lock in of 3 years and tax benefit Inception Date (Date of allotment) March 31, 1996 Investment Objective To generate capital appreciation / income from a portfolio, comprising predominantly of equity & equity related instruments. There is no assurance that the investment objective of the Scheme will be realized. Fund Manager $ Vinay Kulkarni Investment Plans Direct Plan, Regular Plan Investment Option Under Each Plan: Growth & Dividend. The Dividend Option offers Dividend Payout facility. Minimum Application Amount (Under Each Plan/Option) Purchase & Additional Purchase: Rs. 500 and in multiples of Rs. 500 thereafter Load Structure Entry Load: Not Applicable. Upfront commission shall be paid directly by the investor to the ARN Holder (AMFI registered Distributor) based on the investors’ assessment of various factors including the service rendered by the ARN holder. Exit Load: Nil No Entry / Exit Load shall be levied on bonus units and units allotted on dividend reinvestment. In respect
any, prevailing on the date of registration / enrolment shall be levied. Lock-in period 3 Years from the date of allotment of the respective units Tax Benefit U/s 80C of the Income-tax Act, 1961, an individual / HUF is entitled to a deduction up to Rs. 1.5 Lakh (along with other prescribed investments) for amounts invested in HDFC TaxSaver while computing the total income Benchmark NIFTY 500 Total Returns Index
15 $ Dedicated Fund Manager for Overseas Investments: Mr. Chirag Dagli For further details, please refer to the Scheme Information Document/Key Information Memorandum available on our website www.hdfcfund.com.
16 The Scheme may invest in the schemes of Mutual Funds in accordance with the applicable extant SEBI (Mutual Funds) Regulations as amended from time to time. The Scheme may invest upto a maximum 35% of the total assets in Foreign Securities and upto 50% of its total assets in Derivatives. The Scheme may undertake (i) repo / reverse repo transactions in Corporate Debt Securities; (ii) Credit Default Swaps; (iii) Short Selling and such other transactions in accordance with guidelines issued by SEBI from time to time. Pending deployment of funds of the Scheme in securities in terms of the investment objective of the Scheme the AMC may park the funds of the Scheme in short term deposits of scheduled commercial banks, subject to the guidelines issued by SEBI vide its circular dated April 16, 2007, as amended from time to time. For further details refer SID/ Key Information Memorandum available on www.hdfcfund.com.
17
The performance of the Scheme(s) is benchmarked to the Total Return Index (TRI) Variant of the Indices. Past performance may or may not be sustained in the future. The above returns are of Regular Plan – Growth Option. Load is not taken into consideration for computation of performance. On account of difference in the type of the Scheme, asset allocation, investment strategy, inception dates, the performance of these schemes is strictly not comparable. Returns as on January 31, 2020. Different plans viz. Regular Plan and Direct Plan have a different expense structure. The expenses of the Direct Plan under the Scheme will be lower to the extent of the distribution expenses/ commission charged in the Regular Plan.
18
The above scheme has been managed by Vinay Kulkarni since Nov 21, 2006. The performance of the Scheme is benchmarked to the Total Return Index (TRI) Variant of the Indices. Past performance may or may not be sustained in the future. The above returns are of Regular Plan - Growth Option. Returns greater than 1 year period are compounded annualized (CAGR). Load is not taken into consideration for computation of performance. #NIFTY 500 TRI - As Nifty 500 TRI data is not available for March 31, 96, benchmark performance is calculated from March 29, 96. ## NIFTY 50 TRI - As TRI data is not available since inception of the scheme, additional benchmark performance is calculated using composite CAGR of Nifty 50 PRI values from Mar 29, 96 (Data for March 31, 96 is not available) to Jun 29, 99 and TRI values since Jun 30, 99. Different plans viz. Regular Plan and Direct Plan have a different expense structure. The expenses of the Direct Plan under the Scheme will be lower to the extent of the distribution expenses / commission charged in the Regular Plan. Returns as on January 31, 2020. *Inception date March 31, 1996. $$ All dividends declared prior to the splitting of the Scheme into Dividend & Growth Options are assumed to be reinvested in the units of the Scheme at the then prevailing NAV (ex- dividend NAV).
19
20