
SLIDE 1
COMPANY RESULTS FULL YEAR 2020
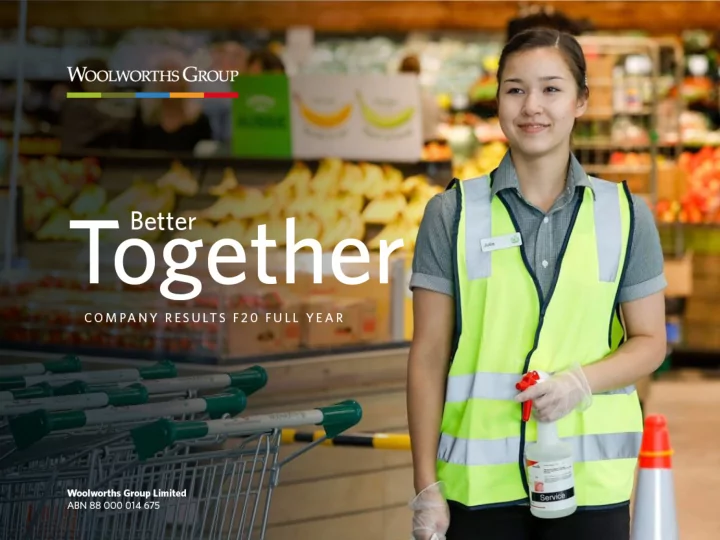
1
1 FULL YEAR 2020 Woolworths Group Purpose Contents F20 Group - - PowerPoint PPT Presentation
COMPANY RESULTS 1 FULL YEAR 2020 Woolworths Group Purpose Contents F20 Group Summary & Progress 4 Brad Banducci Group Financial Results 14 Stephen Harrison Business Performance Update 28 Outlook 57 Brad Banducci Living our
COMPANY RESULTS FULL YEAR 2020
1
4 F20 Group Summary & Progress Brad Banducci 14 Group Financial Results Stephen Harrison Business Performance Update 28 57 Outlook Brad Banducci
COMPANY RESULTS FULL YEAR 2020
4
At Woolworths Group we have adapted the way we operate in this new stage of the pandemic, making COVIDSafe a part of everything we do. Since the recent acceleration in community transmission across Victoria, we have had to learn and respond quickly to develop new practices that look after our team and customers. This includes the establishment of a COVIDSafe Tribe and the appointment of a Chief Medical Officer to advise and work across the Group as we continue in this new way of working for the foreseeable future.
COMPANY RESULTS FULL YEAR 2020
5
Fresh Departments and Support Offices
45 minutes within each shift
all team members
entry as well as clean basket and trolley handles
stations when not serving customers
COMPANY RESULTS FULL YEAR 2020
6
COMPANY RESULTS FULL YEAR 2020
7
Better for Customers, Simpler and Safer for Stores and Support Connected, Convenient and Safe Ways to Shop Customer 1st Team 1st Brand & Culture Build connected capabilities for the future Create differentiation in all our businesses Lean operating model leveraging core platforms Differentiate our Food Customer Propositions Evolve our Drinks Business Unlock Value in our Portfolio We create better experiences together for a better tomorrow
COMPANY RESULTS FULL YEAR 2020
8
eStores in Carrum Downs, VIC and Penrose and Moorhouse, NZ. Smart Stores in Rototuna, NZ and Millers Junction, VIC and Chullora, NSW
237 tonnes of plastic packaging removed across produce in F20
and specials; My Dan’s growing strongly
eCommerce services
most trusted brand during COVID-19 by Roy Morgan Risk Monitor
COMPANY RESULTS FULL YEAR 2020
9
safety during COVID
trading terms
Frequent Flyer relaunch. Announced strategic investment in PFD Food Services
Work, Cartology
separation
during COVID
Endeavour Group
COMPANY RESULTS FULL YEAR 2020
10
Provi
ng additiona
ervi vices es and points of presence for customers so they can shop when, w hen, wher here & how how t they hey want nt 1 Lever everagi ging ng our Food
bus usines ness for B2 B2B B custo stomers s and food
ervi vice e adjacenc encies es b bot
h, domestic and international 2 Ena nabling our ng our W Wool
bus usines nesses es with strong d
gital platf tforms ms (e.g. Digital & Media, Loyalty & Fintech) Extend ending choi hoice e for our customers to meet eet t thei heir ever everyd yday need y needs (via our businesses and partners) 3 4
COMPANY RESULTS FULL YEAR 2020
11
1,000 2,000 3,000 4,000 F15 F16 F17 F18 F19 F20 Australian Food New Zealand Food BIG W Endeavour Drinks
1 Normalised results and growth reflect adjusted F19 to remove the impact of the 53rd week 2 BIG W online sales previously fulfilled by EziBuy
$M
1-YR G R GRO ROWTH1 5-YR C CAGR GR
Australian Food 43.1% 25.2% New Zealand Food 44.5% 38.8% BIG W 66.8% 148.5% Endeavour Drinks 28.6% 13.6% Group 41.8% 26.1%
26.1%
1 2
COMPANY RESULTS FULL YEAR 2020
12
Keep our business COVIDSafe and future proof our E2E operating model Accelerate Digital, eCom and convenience for connected customers Better Together for a Better Tomorrow for our customers, teams and communities Maintain trust with our customers, team and communities Deliver store and eStore propositions that meet changing customer needs Future proof our E2E
Differentiate our food customer propositions Stand-up Endeavour Group Evolve our Portfolio & build adjacencies We create better experiences together for a better tomorrow
4 F20 Group Summary & Progress Brad Banducci 14 Group Financial Results Stephen Harrison Group financial results Key balance sheet metrics Capital management framework Cash flow summary Capital expenditure Capital management Supply Chain transformation Business Performance Update 28 57 Outlook Brad Banducci
COMPANY RESULTS FULL YEAR 2020
15
1 Certain comparatives have been re-presented to conform with the current period’s presentation to better reflect the nature of the financial position and performance of the Group. The impact of the costs to remediate
salaried team members has been corrected by the restatement of each of the affected financial statements line items for prior periods in accordance with the requirements for the correction of an error under AASB 108
2 Normalised results and growth reflect adjustments to F19 for the 53rd week impact in F19 and if AASB 16 had been in place in F19
$ MILLION REPORTED F20 (52 WEEKS) REPORTED1 F19 (53 WEEKS) CHANGE
Continuing operations before significant items Sales 63,675 59,984 6.2% EBIT 3,219 2,722 18.3% NPAT attributable to equity holders of the parent entity 1,602 1,751 (8.4)% Basic EPS – cents 127.5 134.2 (5.0)% Group after significant items EBIT 2,628 2,351 11.8% NPAT attributable to equity holders of the parent entity 1,165 2,692 (56.7)% Dividend per share – cents 94 102 (7.8)%
$ MILLION REPORTED F20 NORMALISED2 F19 NORMALISED2 CHANGE
Continuing operations before significant items (post-AASB 16) Sales 63,675 58,885 8.1% EBITDA 5,677 5,534 2.7% EBIT 3,219 3,232 (0.4)% NPAT attributable to equity holders of the parent entity 1,602 1,624 (1.2)% Rep Repor
ed Nor
ed for
AASB SB 16 a and nd 53 53rd
rd week
eek
COMPANY RESULTS FULL YEAR 2020
16
$ MILLION REPORTED F20 NORMALISED1 2 3 F19 NORMALISED1 CHANGE REPORTED H2 F20 NORMALISED1 2 3 H2 F19 NORMALISED CHANGE
Continuing operations before significant items Australian Food 2,232 2,099 6.3% 1,055 1,009 4.6% New Zealand Food 358 320 12.0% 183 159 15.3% New Zealand Food (NZD) 378 342 10.7% 192 167 15.1% BIG W 39 (31) n.m. (11) (51) (77.2)% Endeavour Drinks 569 538 5.7% 231 222 4.2% Hotels 172 351 (51.0%) (52) 144 n.m. Central overheads3 (151) (45) 229.8% (80) 49 n.m. EBIT 3,219 3,232 (0.4)% 1,326 1,532 (13.3)% EBIT (excluding Hotels and central overheads) 3,198 2,926 9.3% 1,458 1,339 8.8% Significant items from continuing operations (591) (371) n.m. (460) (371) n.m. EBIT from continuing operations after significant items 2,628 2,861 (8.1)% 866 1,161 (25.3)% Gr Group E p EBIT/(LB LBIT) Po Post-AASB 1 16
1 Normalised results and growth reflect adjustments to F19 for the 53rd week impact in F19 and if AASB 16 had been in place in F19
2 Certain comparatives have been re-presented to conform with the current period’s presentation to better reflect the nature of the financial position and performance of the Group 3 The impact of the costs to remediate salaried team members has been corrected by the restatement of each of the affected financial statements line items for prior periods in accordance with the requirements for the correction
F2 F20 H2 H2 F2 F20
COMPANY RESULTS FULL YEAR 2020
17 41.3 40.0 39.0 39.5 37.0 40.8 37.6 36.0 37.2 37.0 F16 F17 F18 F19 F20
Average inventory days
Days
Normalised ROFE
Percentage
Continuing operations – post-AASB 16 Continuing operations – pre-AASB 16
All numbers exclude significant items inF16, F19 and F20
Continuing operations Group
14.1 13.7 24.2 F19 F20 Group ROFE decreased 49 bps driven by decline in Hotels earnings. Ex Hotels, ROFE improved Average inventory days declined by 2.5 days due to underlying improvements through the year and higher sales due to COVID-19
COMPANY RESULTS FULL YEAR 2020
18
Investment proposition Capital allocation to sustain business and support shareholder returns Disciplined capital allocation to manage free cash flow One of Australia’s leading & most trusted brands Strong cash flow from AUS and NZ businesses Strong market position in Food, Drinks & Everyday Needs Sustaining capital Typically 70-75% dividend payout (fully-franked) Special dividends or buybacks to distribute excess cash and franking credits to shareholders Return excess capital Improve credit quality and capacity to invest for the future Debt reduction Organic and inorganic growth that exceeds minimum return hurdles Investment in growth Strong defensive characteristics through the cycle Growth
eCom & adjacencies Strong operating cash flow generation Free cash flow Solid investment grade credit rating
COMPANY RESULTS FULL YEAR 2020
19
$ MILLION REPORTED F20 (52 WEEKS) REPORTED1 F19 (53 WEEKS) CHANGE
EBITDA – continuing operations 5,677 3,944 44.0% +ve AASB 16 impact with fixed rent becoming lease interest and repayment of lease liabilities. Normalised EBITDA growth of 2.7% from continuing operations before significant items EBITDA – discontinued operations
n.m. Significant items (591) 717 n.m. EBITDA growth impacted by discontinued
Group EBITDA 5,086 4,773 6.6% Working capital and non-cash movements 981 (915) n.m. Impacted by higher trade payables and non- cash gain on sale of Petrol in F19 Operating activities before interest & tax 6,067 3,858 57.4% Interest paid – leases (701)
now lease interest Interest paid – non-leases (155) (166) (6.6)% Tax paid (650) (744) (12.6)% Operating activities 4,561 2,948 54.9% Capex discussed on slide 21. F19 includes cash proceeds on sale of Petrol Investing activities (1,945) (246) n.m. Free cash flow before lease payments, dividends and share issues 2,616 2,702 (3.0)% Dividends and share payments (1,301) (3,079) (57.7)% F19 incl. cash payment of F18 10c special dividend and off-market share buyback Repayment of lease liabilities (1,066)
now repayment of lease liabilities Free cash flow after lease payments, dividends and share issues 249 (377) n.m. Cash realisation ratio (CRR) 124.4% 74.1%
1 Certain comparatives have been re-presented to conform with the current period’s presentation to better reflect the nature of the financial position and performance of the Group. The impact of the costs to remediate salaried team members
has been corrected by the restatement of each of the affected financial statements line items for prior periods in accordance with the requirements for the correction of an error under AASB 108
COMPANY RESULTS FULL YEAR 2020
20
Sustaining capex Growth Operating capex Renewals Stay-in-business (SIB) - Maintenance, planned replacements, emergency and safety measures Productivity - Projects related to cost reduction (e.g. Simpler for Stores, energy projects) IT Supply Chain Other growth – Logistics, Upgrades, commercial projects (store or category initiatives), projects that result in sales / gross profit increase New stores eCom / Digital - eCom and digital platforms such as software, equipment for stores, and data analytics
COMPANY RESULTS FULL YEAR 2020
21
$ MILLION
F20 F191
Continuing operations Operating capex 1,644 1,735 Property development2 585 369 Gross capex 2,229 2,104 Property sales (269) (164) Net capex 1,960 1,940 Discontinued operation
Group net capex 1,960 1,963 Lease asset additions 855
2 Property acquisitions now included in property development, previously in operating capex. The comparative has been re-presented on the same basis
F21 operating capex expected to be ~$1.9 billion, driven by investment in eCom, digital and supply chain
Sustaining capex
$ MILLION
F20 F19
SIB 335 351 Renewals 364 462 Supply Chain 104 166 IT 177 177 Productivity 124 127
$ MILLION
F20 F19
New stores 162 94 eCom / Digital 160 127 Other growth 218 231 Growth Operating capex
COMPANY RESULTS FULL YEAR 2020
22
10 10
43 43 45 45 46 46 50 50 57 57 48 48
10
70 70.6% 70.3% 3% 74 74.0%
F18 F19 F20
Final Interim Special Full year payout ratio2
94 cps full year dividend in line with F19
(excluding non-recurring items)
than prior year but consistent with F19 when excluding non-recurring Petrol earnings and 53rd week in F19
impact of AASB 16; and
discount Committed to solid investment grade credit ratings S&P: BBB (stable outlook)3 Moody’s: Baa2 (stable outlook)3
headroom above thresholds for current ratings
Sources of funding and liquidity remain strong
1,000 1,500 2,000
2021 2022 2023 2024 2025 Beyond Debt maturity profile ($m)
Capital markets debt Bank debt4
during COVID-19
tranches, further lowering effective interest rate. This refinances the US$617m US144a bond and JPY20bn EMTN bond maturing in H1 F21
committed facilities of $3,031m6
1 Includes discontinued operations and 53rd trading week 2 Based on Group NPAT attributable to equity holders of the parent entity before significant items 3 Credit ratings issued by a credit rating agency which holds an Australian Financial Services Licence authorised to issue credit ratings to wholesale clients only and are published for the benefit of the Group’s debt providers 4 Total committed facilities (drawn and undrawn) 5 Excluding lease liabilities 6 Benefitting from the proceeds from the A$1bn bond issued in May 2020 which will be used to repay the bonds maturing in September and November 2020
Dividends (cents per share)
Includes US$617m US144a bond & JPY20bn EMTN bond maturing in H1 F21 already refinanced in May 2020
1
103 102 94
8
Non-recurring 53rd week & Petrol
COMPANY RESULTS FULL YEAR 2020
24
Melbourne MSRDC (Ambient) Adelaide RDC (Ambient, Liquor, TC) Townsville RDC (Ambient, Liquor)
10,800 sqm ambient & 4,800 sqm temperature control expansion zone June 2 2020 All stores transitioned from
Feb ebruary 2 y 2019 019 5,300 sqm expansion. Additional ~400 ambient and 70 liquor range May 2 2020
Melbourne Fresh DC (MFDC)
Development of a new 35,000 sqm Fresh DC Au August 2 2020
Tasmania RDC (Temperature-controlled)
12,335 sqm temperature- controlled DC Sep Septem ember er 2 2019 019
Heathwood DC QLD (Frozen and Chilled)
42,000 sqm facility co-located with Hilton Meats facility DA l DA lodged F February 2020
Operational
New Zealand Palmerston North RDC
Development of a new 38,000 sqm DC La Late te 2 2021
In development
Micro-fulfilment capability
First eStores to open at Carrum Downs, VIC (Q2 F F21), Penrose & Moorhouse, NZ (Q (Q3 F F21) )
COMPANY RESULTS FULL YEAR 2020
25
Hume MSRDC
Safety F19 Total recordable injuries: 28 Lost hours: 12,428 F20 Total recordable injuries: 3 Lost hours: 1,415 Team 700 371 Storage (reserve slots) 27,000 60,000 (high bay) + 7,500 (manual rack) Throughput Order Multiples (OMs) per week 1.58m (F19 - pre transition) ~82m OMs annual 2.5m (design level) ~130m OMs annual (1.9m reached during COVID) (2.0m reached during August) Cost Per Carton $1.18 ~$0.85 (design level) ~$1.00 (2.0m OMs per week) Range 3,900 SKUs 13,000 SKUs (design level) Family Grouping High level grouping of products Store specific - grouped by aisle built pallets Accuracy 99.39% 100%
COMPANY RESULTS FULL YEAR 2020
26
Subsequent changes to the NSW network Development of two DCs co-located in Moorebank, NSW
Airbridge eliminating transport legs
NSW Re Regio ional D l DC Fully automated
A
Nationa
DC Semi automated
Shared infrastructure, shared site management and shared fleet
Closure of Minchinbury DC Ambient (SRDC) Closures of Melbourne NDC (Mulgrave) and Sydney NDC (Yennora) Relocation of the Support Offices (VIC and NSW)
Minchinbury Moorebank Yennora
B
Safer and simplified supply
chain for team and stores
Improved availability Support localisation and
convenience ranging
Enable volume growth -
especially for online
✓ Maximum freshness ✓ Improved lead times and
accuracy of deliveries
✓ Lower end-to-end costs ✓ Reduced stock loss ✓ Better for tomorrow with
5-Star Green Rating This will deliver for our teams, stores and customers:
4 F20 Group Summary & Progress Brad Banducci 14 Group Financial Results Stephen Harrison Business Performance Update 28 57 Outlook Brad Banducci
COMPANY RESULTS FULL YEAR 2020
28
29
COMPANY RESULTS FULL YEAR 2020
REPORTED F20 NORMALISED1,2 F19 NORMALISED1 CHANGE
Sales ($m) 42,151 38,912 8.3% EBITDA ($m) 3,707 3,427 8.2% EBIT before significant items ($m) 2,232 2,099 6.3% Gross margin (%) 29.2 28.7 47 bps Cost of doing business (%) 23.9 23.4 57 bps EBIT to sales (%) 5.3 5.4 (10) bps Sales per square metre ($) 17,935 16,881 6.2% ROFE before significant items (%) 25.0 24.8 14 bps
1 Normalised results and growth reflect adjustments to F19 for the 53rd week impact and if AASB 16 had been in place in F19 2 Comparatives have been re-presented to reflect the transfer of the Summergate business from Endeavour Drinks to Australian Food
30
COMPANY RESULTS FULL YEAR 2020
Total sales (% year on year) Comp transactions (% year on year) Comp sales growth (% year on year)
3.5 3.5% 6.6 .6% 3.8 3.8% 10. 0.3% 8.9 .9%
Q4’1 ’19 Q1’20 20 Q2’ 2’20 20 Q3’ 3’20 20 Q4’2 ’20
* Normalised for the impact of the 53rd week in F19. F19 comparatives have been restated to reflect the transfer of the Summergate business from Endeavour Drinks to Australian Food.
4.0 7.8 4.9 11.3 9.3 Q4'19* Q1'20 Q2'20 Q3'20 Q4'20 1.4 2.8 0.7 0.5
Q4'19* Q1'20 Q2'20 Q3'20 Q4'20 1.2 1.9 0.9 6.2 15.4 Q4'19* Q1'20 Q2'20 Q3'20 Q4'20
Comp items per basket (% year on year)
31
COMPANY RESULTS FULL YEAR 2020
Store-controllable VOC2
% customers satisfied, 6 & 7 out of 7
VOC NPS - Store & Online1
% promoters - % detractors
1 VOC NPS - Store & Online weighted 70% Store and 30% Online 2 In F20, Store-controllable VOC was re-weighted from seven metrics to five 3 A comparable store-controllable VOC was not available in Q3’20 given the suspension of in-store pick up and material impact on availability due to COVID"
+1 +1 +2 52 49 51 44 53 Q4'19 Q1'20 Q2'20 Q3'20 Q4'20 80 80 80 82 Q4'19 Q1'20 Q2'20 n.m. Q4'20
3
32
COMPANY RESULTS FULL YEAR 2020
Doubled eCom network capacity to meet growing customer demand; scaling customer fulfilment centres and 600 additional vehicles
Woolworths Basics Boxes packed and distributed to those in need, including 24,000 donated to charity / government agencies
to Food Relief charity partners since the beginning of COVID-19 Safety of our team prioritised through installation of
plexiscreens and availability of face masks and hand sanitiser More than
Priority Assistance customers served via Home Delivery
permanent team acknowledged for extraordinary efforts during COVID through award of Woolworths Group shares
33
COMPANY RESULTS FULL YEAR 2020
E2E Processes that are Better for Customers, Simpler and Safer for Stores and Support Connected, Personalised and Convenient Ways to Shop my Woolies Customer 1st Brand, Team & Culture Build customer & team advocacy Differentiate our core customer offer Deliver our new E2E
Trusted Prices and Localised Range Engaging and Easy Woolies Experience Famous for Fresh Every Time
34
COMPANY RESULTS FULL YEAR 2020
Build customer & team advocacy Differentiate our core customer offer Deliver our new E2E operating model
BETTER FOR STORES
Simpler for Stores program enabling reinvestment in stores and teams for greater focus on customers
BETTER FOR CUSTOMERS
Roll out of new customer operating model focused on improving customer service and experience
EFFICIENT SUPPLYCHAIN
Ramp up of MSRDC, now with ability to supply to all Victorian stores and on target to reach planned output levels
reduction Total Recordable Injuries
vs F19
team trained as Mental Health First Aiders
TEAM SAFETY
VOC NPS
+9 pts vs Q3F20;+1 vs Q4 F19
Store-controllable VOC
+2% vs Q4 F19
CUSTOMER SCORES
new stores (net)
(12 Supermarkets, 15 Metro)
renewals
(61 Supermarkets, 8 Metro)
STORE NETWORK
F20 Online sales growth;
4.8%sales penetration
Everyday Rewards in-store scan rate
WOOLIES X
June Fresh food customer perception metric v F19
FRESH OFFER
Fresh Made Easy
deployed nationally, including launch of 131 new product lines
new/ re-branded
DIFFERENTIATED RANGE
Ethnic Dept.
launched across 55 stores incl Middle Eastern, South Asian and Halal
Own and Exclusive products
35
COMPANY RESULTS FULL YEAR 2020
Progress a ss against st su sust stainabi bility ta targets ts with 5% reduction in energy and 3% reduction in waste
Cartol
screens ns deployed in 957 stores Launc unch h of
Stor
2.0 technology enabled store enhancing customer and team experience Fir irst sustain inabilit ility s store at B Burw rwood Bric rickwork rks, V VIC operating using 100% renewable energy Open pened ed 27 (net et) n new stores es a and d compl plet eted 6 ed 69 R Ren enewals in F20 bringing the total store network to 1,051 stores First st e eStore a at Ca Carrum D Down wns, s, VIC, IC, designe ned and nd und under cons
uction
in partnership with TakeOff
36
COMPANY RESULTS FULL YEAR 2020
Car Carto tolo logy - our digital media business, connecting brands with our customers at moments that matter Dem emand nd gener generation
customers into our digital assets and channels, powered by our data science capabilities Digi gital exp exper erienc ence creates curated, engaging tools and content on our web and app
Insur Insuranc nce offers solutions across Car, Home, Pet, Landlord and Travel Ever eryday R Rew ewards s delivers more value to our members with trusted, mobile-first moments Pay ayme ments ts an and gift ift car ards
to shop quickly and safely while saving more
Seamless experiences to enjoy a little more, every day Easy shopping when & where you want it
eCo Com offers our customers eas asy, , saf afe an and new ways to shop Woolies - anywhere at anytime Fulfilled by Woolworths
partners (Yello, Sherpa, Uber)
Front door to Woolies
37
COMPANY RESULTS FULL YEAR 2020 Members can earn
140, 0,000 000 points Rewards
points for signing up. We also make it easier for our members to eat healthy by
such as 3x
3x points on Fruit,
Veg and the Macro brand
Rewards ds a app pp went live with e-
receipts and supporting flight for value and contactless shopping
downloads
#1 #1 Google Play #1 #1 App Store
Qa Qant ntas p s partner nershi ship r reset eset
including 15% more value for members, streamlined joining process and immediate vs quarterly conversion of points
+650,000, +5.5%
Everyday Rewards members with improvement in scan rates across all banners
2020 Moz
nline G ne Groc
ery y Peop eople’s e’s C Choi hoice A e Award
Winning all 7 categories
Q4 weekly visits across web & app Dig igital ital me media g ia growth th
Launched Cartology and set up sponsored search in woolworths.com.au
Wool
hs app
Upgrades in F20:
track orders
functionality
Online VOC NP
NPS increased
customer satisfaction to
eCom sales
Penetration of Australian Food sales for Q4
Home Delivery capacity doub doubled
Contactless pick up in 86
86 locations 78 new home delivery stores opened
Deliv livery U Unlim limit ited subscriptions launched Cro Crowd D d Del elivery ery enabled with
Active eCom Customers
+70%
expanded to
10 10 Supermarkets and 7 7 Metro Food Stores
Cashless transactions
New pa partner ership p with B h Bup upa
Priority Assistance
38
COMPANY RESULTS FULL YEAR 2020
Keep our business COVIDSafe and Future proof
Accelerate Digital and eCom for our connected customers We bring a little good to everyone, everyday Bet etter er cu cust stomer an and te team am experienc nce f for
bette tter to tomorrow Deliv liver core p proposit itio ions to
cha hang nging ng cu cust stomer n need eeds Fut utur ure p proof
E2E E
ng m mod
Personalise Value & Localised Range Safe, Fast & Friendly Experiences Lead in Fresh & Make Health Easier
39
COMPANY RESULTS FULL YEAR 2020
40
COMPANY RESULTS FULL YEAR 2020
NZ NZD RE REPORT RTED F20 20 NORMA MALISED ED1 F1 F19 NORMA MALISED ED1 CHA HANG NGE
Sales ($m) 7,192 6,589 9.1% EBITDA ($m) 634 586 8.2% EBIT ($m) 378 342 10.7% Gross margin (%) 25.0 24.4 67 bps Cost of doing business (%) 19.8 19.2 60 bps EBIT to sales (%) 5.3 5.2 7 bps Sales per square metre ($) 17,832 16,323 9.2% ROFE (%) 8.8 7.9 81 bps
1 Normalised results and growth reflect adjustments to F19 for the 53rd week impact and if AASB 16 had been in place in F19
41
COMPANY RESULTS FULL YEAR 2020
Team 1st: COVID response, Better Together Recognition Award, financial wellbeing, team room upgrades, team double- discounts
Customer 1st Team 1st Transformation Digital Growth & Innovative Shopping Experiences Strengthened Core Offer & Brand Differentiation
F20 eCom sales growth F20 eCom penetration Format innovation: Newmarket, Albert St Metro, Rototuna Smart Store, Penrose eStore Injuries (TRI) down 13.8% vs LY Voice of Team +1 to 84% Continued improvement: VOC NPS, Store-controllable VOC ~4,000 products on Great Price Fresh offer upgrades: produce and deli equipment New ‘More Good’ platform: affordable and healthy choices Food For Good launch, $1m donation to community partners across New Zealand Own Brand growth
42
COMPANY RESULTS FULL YEAR 2020
Demonstrate care and support wellbeing Innovate and accelerate digital and eCom Amplify value, NZ fresh, health, community Dial up simpler, smarter foundations
eCom growth Mobile app Digital innovation Safety & Wellbeing Everyday Acts and Care Diversity & Inclusion Simpler For Stores Technology and Analytics End-to-end Excellence Availability Stock loss CODB
43
COMPANY RESULTS FULL YEAR 2020
Innovate to create a great brand to work for and shop
Simpler End-to-End Processes and Capabilities for the Future Innovative, Convenient and Helpful Ways to Shop Customer 1st Team 1st Differentiate our core customer proposition Future proof our E2E
Prices I Trust, Rewards I Value, Exclusive Range Good For Me - with a Focus on NZ Fresh, Health & Wellness Good for My Community and the Planet
COMPANY RESULTS FULL YEAR 2020
44
45
COMPANY RESULTS FULL YEAR 2020
REPORTED F20 NORMALISED1 F19 NORMALISED1 CHANGE
Sales ($m) 4,106 3,717 10.5% EBITDA before significant items ($m) 207 147 40.3% EBIT/(LBIT) before significant items ($m) 39 (31) n.m. Gross margin (%) 31.8 31.2 60 bps Cost of doing business (%) 30.9 32.1 (117) bps EBIT to sales (%) 0.9 (0.8) 176 bps Sales per square metre ($) 3,962 3,552 11.5% ROFE before significant items (%) 3.6 (2.4) 6.0 pts
1 Normalised results and growth reflect adjustments to F19 for the 53rd week impact and if AASB 16 had been in place in F19
46
COMPANY RESULTS FULL YEAR 2020
Much to be proud of in F20
Living our values by demonstrating ‘real care’ in our communities - distributing 5 million free books for kids to families, donating 3.4 million units to our partner Good 360, mobilising in bushfire affected communities Continued simplification of our customer offer to better align with our customers shopping missions– accelerating our Apparel offer and launching trials of
Scaled up our digital business during COVID-19, rapidly launching new hub stores and embedding contactless drive-up across a number of our stores Continuing to put our customer and team first - significant improvement in Voice of Team, Voice of Supplier and NPS, financial performance Launched our ‘biggest ever’ Toy Mania campaign with new solutions for our customers (e.g. e-layby)
Our F21 priorities
Continue to simplify our business and establish our capabilities to be data led Remain competitive on price whilst amplifying ‘real value’ for our customers Provide distinctive solutions to our customers through our destinations and our unique product offering Offer a connected, and digitally enabled experience for our customers and teams Continue to demonstrate ’real care’ for our customers, teams and wider communities
47
COMPANY RESULTS FULL YEAR 2020
48
COMPANY RESULTS FULL YEAR 2020
49
COMPANY RESULTS FULL YEAR 2020
REPORTED F20 NORMALISED1,2 F19 NORMALISED1 CHANGE
Sales ($m) 9,275 8,441 9.9% EBITDA ($m) 826 790 4.4% EBIT ($m) 569 538 5.7% Gross margin (%) 23.1 22.9 20 bps Cost of doing business (%) 17.0 16.6 45 bps EBIT to sales (%) 6.1 6.4 (24) bps Sales per square metre ($) 19,579 18,222 7.4% ROFE (%) 15.1 13.8 122 bps
1 Normalised results and growth reflect adjustments to F19 for the 53rd week impact and if AASB 16 had been in place in F19 2 Comparatives have been re-presented to reflect the transfer of the Summergate business from Endeavour Drinks to Australian Food
50
COMPANY RESULTS FULL YEAR 2020
Contactless service to boot launched and rolled out to over 50% of stores in response to COVID-19 11 new stores taking the total to 241 stores. This includes the new format in Hawthorn, Victoria and smaller format store in Elanora Heights, NSW Continued strong performance in VOC with June at 76, +2pts vs LY Successful re-launch of My Dan’s loyalty
4.5m memberships up +29.5% vs LY
Continued rollout of new store formats including the trial of new format and design innovations Cont
nued ed f foc
us a and nd inves nvestmen ent i in n digi gital to provide customers with a more personalised and seamless experience Enha nhanc ncing g the he in-sto store ex exper erienc ence t e thr hrou
gh improved
tea eam k know nowled edge ge supported by wine merchants and new digital capabilities Build on the successful program relaunch, continuing to grow membership and delivering greater member value and personalisation Addition of 400 small suppliers and over 4,000 SKUs to online marketplace and stores Customer 1st Ranging phase 2 with further store by store range specialisation
51
COMPANY RESULTS FULL YEAR 2020
On n Dem emand nd d del eliver very y ex expand nded ed to over 950 stores and Ube ber Ea r Eats rolled out in Victoria 23 net 3 net new new stor
es a and nd 9 94 Renew Renewals, including 2 Smart Stores, the first Value Store and expanded Asian range Accel eler erate f e foc
us i in n digi gital and nd d del eliver very, supported by BWS on tAPP, to enhance the customer shopping experience Enha nhanc nced ed partner nershi hip with h Ever veryd yday Rew y Rewards, , providing value to customers through personalised rewards Del eliver ver a c cur urated ed a and nd loc
ed r range nge for each store, , leading on key trends Cont
nue our e our Renew Renewal progr
, providing customers with a locally tailored shopping experience Launc unched ed new new va value ue mec echa hani nics, including exclusive member offers and SuperSavers Record B d Brand d NPS NPS a and d VOC p per erfor
nce e in F20, with June VOC at 70, +5pts vs LY Significant 22% reduction in Recordable Injuries Lever everagi ging P ng Pinna nnacle, e, to deliver on trend products and value, driving customer and team advocacy
52
COMPANY RESULTS FULL YEAR 2020
Build effective shared capabilities powered by end-to-end processes and data Deliver increasingly effortless, personal and inspiring experiences Customer 1st Brand, Team and Culture Innovate our customer and team experience Differentiate our core customer offer Redesign our E2E
Regain trend leadership and offer the right range Offer trusted value and prices Deliver consistent and engaging customer service
To connec nnect e every eryone ne with a h a dri rink nks e experi erienc ence th they’ll lo ll love
COMPANY RESULTS FULL YEAR 2020
53
Broadbeach Tavern, QLD
54
COMPANY RESULTS FULL YEAR 2020
RE REPORT RTED F20 20 NORMA MALISED ED1 F1 F19 NORMA MALISED ED1 CHA HANG NGE
Sa Sales ($ ($m) 1, 1,320 20 1,6 ,639 (1 (19.5)% )% EBITDA ($m) 405 593 (31.4)% EBI EBIT ( ($m) 172 72 351 51 (5 (51.0)% )% Gross margin (%) 83.0 83.6 (67) bps Cost of doing business (%) 70.0 62.2 771 bps EBIT to sales (%) 13.0 21.4 (838) bps ROFE (%) 4.2 8.7 (4.4) pts
1 Normalised results and growth reflect adjustments to F19 for the 53rd week impact and if AASB 16 had been in place in F19
Victoria
capacity until hotels restrictions were lifted
and certainty for team
55
COMPANY RESULTS FULL YEAR 2020
28 Hotels
24/06 => Stage 4 1 person /2 sqm
4 Hotels F&B: OPEN EGMs: 100%
5/06 => Stage 3 1.5m social distancing
F&B: OPEN 127 Hotels F&B: OPEN EGMs: 100%
3/07 => Stage 3 Seated 1 person /4 sqm
33 Hotels F&B: OPEN EGMs: 59%
29/06 => Step 3 1 person / 2 sqm
52 Hotels F&B: OPEN EGMs: 57%
24/07 => Seated 1 person / 4 sqm
80 Hotels F&B: CLOSED EGMs: CLOSED 2/08 =>VIC metro Stage 4 5/08=> VIC regional Stage 3 5 Hotels F&B: OPEN EGMs: 100%
26/06 => Stage 3 Seated 1 person /2 sqm
4 F20 Group Summary & Progress Brad Banducci 14 Group Financial Results Stephen Harrison Business Performance Update 28 57 Outlook Brad Banducci
COMPANY RESULTS FULL YEAR 2020
57
TOTAL SALES GROWTH YEAR ON YEAR
Australian Food 11.9% New Zealand Food (NZD) 8.3% BIG W 21.1% Endeavour Drinks 23.7% Hotels (31.3)% Group sales 12.4% Group online sales 84.6%
Group (except Hotels) for first 8 weeks
elevated
year
progress on strategic priorities expected
trading through Pick up, Drive up and Home Delivery (from some stores)
Victoria remain closed
Current trading F21 – 8 weeks to 23 August Total COVID-19 costs1 $107 million 1.1% of sales
1 Refer to slide 59 for detail
COMPANY RESULTS FULL YEAR 2020
58
4 8 12 16 20 24
W1 W2 W3 W4 W5 W6 W7 W8
Australian Food
YoY growth % 2-yr avg. growth %
4 8 12 16 20 24
W1 W2 W3 W4 W5 W6 W7 W8
New Zealand Food
YoY growth % 2-yr avg. growth %
8 16 24 32 40
W1 W2 W3 W4 W5 W6 W7 W8
BIG W
YoY growth % 2-yr avg. growth %
8 16 24 32 40
W1 W2 W3 W4 W5 W6 W7 W8
Endeavour Drinks
YoY growth % 2-yr avg. growth %
COMPANY RESULTS FULL YEAR 2020
59
$ MILLION Q3 F20 Q4 F20 H2 F20 F21 (8 WEEKS)
Cleaning and PPE 31 74 105 46 Contractors and security 15 39 54 4 Store team costs1 31 86 117 19 Supply Chain 20 29 49 23 COVID costs before discretionary payments 97 228 325 92 Team discounts, incentives & recognition payments2 18 49 67 14 Donations3 1 11 12 1 Total COVID costs 116 288 404 107 Costs as a % of sales 2.1%4 2.0% 2.0%5 1.1%
continued into F21 but at a lower rate
elevated as we continue to ensure the safety of our teams and customers
1 Represents incremental team members and roles, to support COVID crisis management and customer and team safety (and excludes any incremental variable cost driven by higher sales) 2 Only includes incremental recognition payments over and above portion funded by reduction in awards to STI eligible team members 3 FareShare, OzHarvest, Foodbank and Basics Box donations 4 Calculated based on sales for March only 5 Calculated based on sales from March to June
Note: Excludes costs of closure of stores and hotels in Victoria
COMPANY RESULTS FULL YEAR 2020
60
Cash realisation ratio Operating cash flow as a percentage of Group net profit after tax before depreciation and amortisation Comparable sales Measure of sales which excludes stores that have been opened or closed in the last 12 months and demonstrable impact on existing stores from store disruption as a result of store refurbishment or new store openings/closures Cost of doing business (CODB) Expenses which relate to the operation of the business Customer 1st Ranging Developing a clearly defined range to provide an easier shopping experience for the customer Customer fulfilment centre (CFC) Dedicated online distribution centres Drive Convenient options for customers to pick up online orders through Drive up or Drive thru facilities E2E End-to-End eStore Store which utilises automation for the fulfilment of online orders Free cash flow Cash flow generated by the Woolworths Group after equity related financing activities including dividends and repayment of lease liabilities Funds employed Net assets employed excluding net tax balances MFC Micro-fulfilment centre MSRDC Melbourne South Regional Distribution Centre Net assets employed Net assets excluding net debt and other financial assets and liabilities Net Promoter Score (NPS) A loyalty measure based on a single question where a customer rates a business on a scale of zero to 10. The score is the net result of the percentage of customers providing a score of nine or 10 (promoters) less the percentage of customers providing a score of zero to six (detractors) On-demand/express delivery An express or scheduled delivery service providing online orders at the customer's convenience Pick up A service which enables collection of online shopping orders in-store or at select locations PPE Personal protective equipment
COMPANY RESULTS FULL YEAR 2020
61
Renewals A total store transformation focused on the overall store environment, team, range and process efficiency (including digital) Return on Funds Employed (ROFE) ROFE is calculated as EBIT before significant items for the previous 12 months as a percentage of average (opening, mid and closing) funds employed including significant items provisions Sales per square metre Total sales for the previous 12 months by business divided by average trading area Simpler for Stores Simplification of end-to-end processes for store teams, improving customer experience and productivity Smart Store A store that employs technology to improve process efficiency from customers and team members Total net debt Borrowings less cash balances including debt hedging derivatives and lease liabilities Total stock loss The value of stock written-off, wasted, stolen, cleared, marked-down or adjusted from all stores nationally (sometimes expressed as a percentage of sales) Voice of Customer (VOC) Externally facilitated survey of a sample of Woolworths Group customers where customers rate Woolworths Group businesses on several criteria. Expressed as the percentage of customers providing a rating of six or seven on a seven-point scale VOC NPS VOC NPS is based on feedback from Woolworths Rewards members. VOC NPS is the number of promoters (score
Voice of Supplier (VOS) A survey of a broad spectrum of suppliers facilitated by an external provider. The survey is used to provide an
the suppliers’ rating across various attributes scored as a percentage of suppliers that provided a rating of six or seven on a seven-point scale Voice of Team (VOT) Survey measuring sustainable engagement of our team members as well as their advocacy of Woolworths as a place to work and shop. The survey consists of nine sustainable engagement questions, three key driver questions and two advocacy questions
COMPANY RESULTS FULL YEAR 2020
62
Other non-IFRS measures used in describing the business performanceinclude:
COMPANY RESULTS FULL YEAR 2020
64
$ MILLION PRE-AASB 16 NORMALISED1 F20 52 WEEK BASIS NORMALISED2 3 F19 PRE-AASB 16 NORMALISED1 CHANGE
Cont
nuing ng op
signi nificant nt items Australian Food 1,921 1,793 7.2% New Zealand Food 309 269 14.1% New Zealand Food (NZD) 324 288 12.7% BIG W (18) (84) (78.8)% Endeavour Drinks 512 496 3.4% Hotels 77 258 (70.3)% Central Overheads (152) (60) 151.7% EBIT from continuing operations before significant items 2,649 2,672 (0.9)%
Gro roup EB EBIT/( /(LBIT) P Pre re-AAS AASB 1 16
1 Normalised results and growth reflect adjustments to F19 for the 53rd week impact and adjustments to F20 as if AASB 16 had not been in place 2 Certain comparatives have been re-presented to conform with the current period’s presentation to better reflect the nature of the financial position and performance of the Group 3 The impact of the costs to remediate salaried team members has been corrected by the restatement of each of the affected financial statements line items for prior periods in accordance with the requirements for the
correction of an error under AASB 108
COMPANY RESULTS FULL YEAR 2020
65
F201
$ MILLION
Pre-AASB 16 NORMALISED2 REPORTED Impact of AASB 16
EBITDA before significant items 3,949 5,677 1,728 D&A (1,300) (2,458) (1,158) EBIT before significant items 2,649 3,219 570 Interest expense (142) (843) (701) Income tax expense (769) (730) 39 Non-controlling interests (47) (44) 3 NPAT before significant items attributable to equity holders of the parent entity 1,691 1,602 (89)
F19
$ M $ MILLION ON
REP EPORTED ED3 Po Post st-AAS AASB 1 164 Impa pact o
AASB 16
EBITDA before significant items 3,944 5,610 1,666 D&A (1,222) (2,320) (1,098) EBIT before significant items 2,722 3,290 568 Interest expense (126) (845) (719) Income tax expense (779) (733) 46 Non-controlling interests (66) (59) 7 NPAT before significant items attributable to equity holders of the parent entity 1,751 1,653 (98)
1 Before significant items 2 Normalised results and growth reflect adjustments to F20 if AASB 16 had not been in place in F20 3 Certain comparatives have been re-presented to conform with the current period’s presentation to better reflect the nature of the financial position and performance of the Group. The impact of the costs to remediate salaried team
members has been corrected by the restatement of each of the affected financial statements line items for prior periods in accordance with the requirements for the correction of an error under AASB 108
4 Results reflect adjustments to F19 as if AASB 16 had been in place
COMPANY RESULTS FULL YEAR 2020
66
This presentation contains summary information about Woolworths Group Limited (Woolworths Group) and its activities current as at the date
announcements filed with the Australian Securities Exchange, available at www.asx.com.au. Information about Woolworths Group's financial performance is current as at the last announcement provided to the Australian Securities Exchange. This presentation has not been audited in accordance with Australian Auditing Standards. This presentation contains certain non-IFRS measures that Woolworths Group believes are relevant and appropriate to understanding its
This presentation is for information purposes only and is not a prospectus or product disclosure statement, financial product or investment advice or a recommendation to acquire Woolworths Group shares or other securities. It has been prepared without taking into account the
appropriateness of the information having regard to their own objectives, financial situation and needs and seek legal and taxation advice appropriate to their jurisdiction. Past performance is no guarantee of future performance. No representation or warranty, expressed or implied, is made as to the fairness, accuracy, completeness or correctness of the information,
corporate, or their respective directors, employees or agents, nor any other person accepts liability for any loss arising from the use of this presentation or its contents or otherwise arising in connection with it, including, without limitation, any liability from fault or negligence. This presentation may contain forward-looking statements including statements regarding our intent, belief or current expectations with respect to Woolworths Group’s business and operations, market conditions, results of operations and financial condition, specific provisions and risk management practices. When used in this presentation, the words ‘plan’, ‘will’, ‘anticipate’, ‘expect’, ‘may’, ‘should’ and similar expressions, as they relate to Woolworths Group and its management, are intended to identify forward-looking statements. Forward looking statements involve known and unknown risks, uncertainties and assumptions and other important factors that could cause the actual results, performances or achievements of Woolworths Group to be materially different from future results, performances or achievements expressed or implied by such statements. Readers are cautioned not to place undue reliance on these forward-looking statements, which speak only as of the date thereof.
COMPANY RESULTS FULL YEAR 2020
67