
SLIDE 1
1
Growing Global
………………………………………………………………………………………………………………………………………………………………………………….. Innovation Quality
Growing Global
………………………………………………………………………………………………………………………………………………………………………………….. Innovation Quality
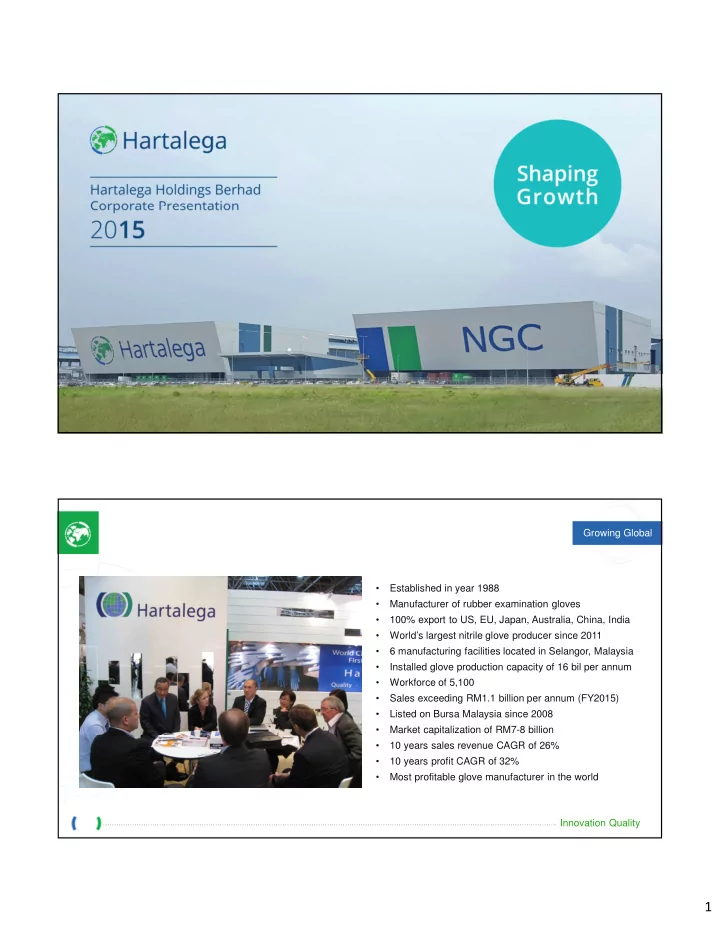
- Established in year 1988
- Manufacturer of rubber examination gloves
- 100% export to US, EU, Japan, Australia, China, India
- World’s largest nitrile glove producer since 2011
- 6 manufacturing facilities located in Selangor, Malaysia
- Installed glove production capacity of 16 bil per annum
- Workforce of 5,100
- Sales exceeding RM1.1 billion per annum (FY2015)
- Listed on Bursa Malaysia since 2008
- Market capitalization of RM7-8 billion
- 10 years sales revenue CAGR of 26%
- 10 years profit CAGR of 32%
- Most profitable glove manufacturer in the world