1. Overview - 1 - 2. Summary Results 1) Consolidated Company - - PDF document

1 overview
SMART_READER_LITE
LIVE PREVIEW

1. Overview - 1 - 2. Summary Results 1) Consolidated Company - - PDF document

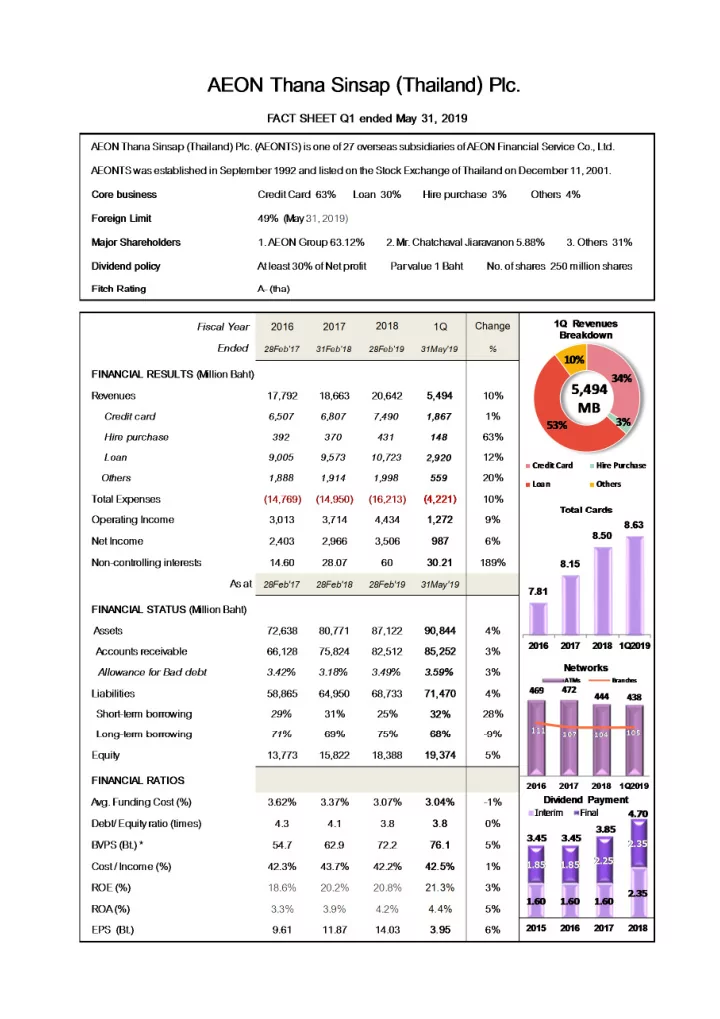
1. Overview - 1 - 2. Summary Results 1) Consolidated Company Performance The Company's core business is retail finance services, including, credit card, personal loan and hire purchase. The credit card business representing 63% of total trading


slide-1
SLIDE 1
slide-2
SLIDE 2
slide-3
SLIDE 3
  • 1. Overview
  • 1 -
slide-4
SLIDE 4
  • 2. Summary Results
  • 2 -

1) Consolidated Company Performance The Company's core business is retail finance services, including, credit card, personal loan and hire purchase. The credit card business representing 63% of total trading volume, loan shares 30%, hire purchase shares 3%, and others 4%, respectively. Amount y-y Amount y-y Amount y-y Amount y-y

  • On October 5, 2011, the Company has consolidated AEON SPECIALIZED BANK (CAMBODIA) PLC, established in Cambodia to conduct

retail fiance business, currently holding with 50% of ownership, and 50% from AFS Corporation.

  • On November 2, 2012 and January 11, 2011, the Company established AEON Microfinance (Myanmar) Co., Ltd.

and AEON Leasing Service (Lao), respectively, to conduct retail finance business, holding 100%

  • Since September 2012, the company has consolidated ACS Servicing (Thailand) Co., Ltd and AEON Insurance to its financial statements.

ACSS is debt collection services company while AEON Insurance is life & non life insurance brokers.

  • The Company has changed the accounting period from end of February 20th to end on the last day of February.

Par Value : Baht Book Value : Baht Dividend Payment : Baht Payout Ratio : %

Note: The Company changed par value from 5 Baht to 1 Baht in June 2004.

  • 7%

(Million Baht) 1Q 31May'19 1.00 5,494 1Q 31May'19 10% 28,285 10% 987 6% 28Feb'19 28Feb'19 105,144 4% 20,642 33.5% 20.8% 87,122 68,733 18,388 3.95 4.4%

  • 90,844

71,470 19,374 20.9% 14.03 4.2% 20.7% 4.70 21.3%

  • 76.1

1.00 72.2 3,506 101,151 11% 2018 18% 18,663 5% 2,966 23% 2017 31Feb'18 11% 2018 Turnover Revenues Net Income Earning per share (EPS) : Baht Assets Fiscal Year Fiscal Year Liabilities Return on Asset (ROA) : % Return on Equity (ROE) : % Equity Equity ratio 32.4% 64,950 15,822 19.5% 3.85 11.87 4.1% 20.2% 80,771 2016 28Feb'17 1.00 62.9 17,792 2% 2,403

  • 2%

2016 28Feb'17 90,817

  • 2017

31Feb'18 1.00 67.8 3.71 4.6% 22.6% 82,105 65,158 16,947 20.6%

slide-5
SLIDE 5
  • 3. Industry Overview
  • 3 -

1) Economic Indicators

Gross Domestic Product (y-y) Private Consumption Expenditures Headline Inflation Unemployment rate

Source : NESDB, BOT, and UTCC

2) Credit Card and Personal Loan under Supervision in Thailand

Amount y-y Amount y-y Amount y-y Amount y-y

Credit Card Number of Account (million accounts) 20.14 6% 20.33 1% 22.11 9% 22.47 9% Credit Outstanding (billion baht) 360.10 8% 394.12 9% 418.75 6% 386.64 8% Personal Loan under Supervision Number of Account (million accounts) 12.18 3% 12.78 5% 13.41 5% 13.89 8% Loan Outstanding (billion baht) 333.00 5% 354.24 6% 383.28 8% 492.09 39%

Source : Bank of Thailand

3) Number of AEONTS Cards

Number of Credit Cards (million cards) Number of Member Cards (million cards)

4) AEONTS Networks

Branches

Bangkok Province

ATMs (machine)

Bangkok Province

Affiliated Dealers

Bangkok Province

*We closed mini-counters and inactive dealers.

Number of Customers Number of Dealers 11 12 16 Cambodia, Laos and Myanmar 31 Dec'17 31 Dec'18 125,000 173,000 262,676

69% 46% 54%

17,463

31%

111

35% 65%

469 28Feb'17 2.38 5.43 0.2% 1.0% 31 Dec'16 28Feb'17

2016

31 Dec'16

3.3% 3.0% 8.15 28Feb'18 7.81 Total (million cards) 2.50 5.65

2018

31 Dec'18

3.7% 5.3% 0.8% 31 Dec'17 1.1% 31 Dec'18 28Feb'19

2017

31 Dec'17

3.9% 3.2% 0.7% 1.2% 28Feb'18

5) Oversea Businesses

2.62 5.90 8.52 1,977 28Feb'19 104

31%

2,302 3,818 4,851*

22% 69% 45% 55%

17,767

31%

107

33% 67%

472 31 Dec'16 31Mar'19 2.68 Number of Branches

69%

440

78% 42% 58%

16 6,307

25% 75%

31 Mar'19 287,330 4,192 5.95 8.63 31Mar'19 105

30% 70%

438

41% 59%

1Q

31 Mar'19

2.8% 4.6% 0.7% 0.9% 31 Mar'19

slide-6
SLIDE 6
  • 4. Financial Highlights
  • 4 -

1) Turnovers

(Million Baht)

Fiscal Year

Amount

%

y-y Amount

%

y-y Amount

%

y-y Amount

%

y-y AEONTS (Consolidated) 90,817 100%

  • 7%

101,151 100% 11% 105,144 100% 4% 28,285 100% 10% Cambodia 1,534 2% 34% 1,890 2% 23% 3,309 3% 75% 1,248 4% 95% Myanmar 795 0.9% 3% 1,280 1% 61% 2,119 2% 66% 689 2% 43% Laos 207 0.2% 104% 331 0.3% 60% 390 0.4% 18% 88 0.3% 3%

2) Revenues

(Million Baht)

Fiscal Year

Amount

%

y-y Amount

%

y-y Amount

%

y-y Amount

%

y-y

  • 1. Credit Card

6,507 37% 4% 6,807 37% 5% 7,490 36% 10% 1,867 34% 1%

  • 2. Hire Purchase

392 2%

  • 9%

370 2%

  • 6%

431 2% 17% 148 3% 63%

  • 3. Loan

9,005 51% 2% 9,573 51% 6% 10,723 52% 12% 2,920 53% 12%

  • 4. Collection income

209 1% 3% 234 1% 12% 266 1% 14% 67 1% 5%

  • 5. Commission income

471 3%

  • 1%

492 3% 5% 513 2% 4% 133 2% 6%

  • 6. Bad debt recovery

500 3%

  • 6%

603 3% 21% 764 4% 27% 234 4% 38%

  • 7. Others

708 4% 2% 585 3%

  • 17%

455 2%

  • 22%

125 2% 14% Total (Consolidated) 17,792 100% 2% 18,663 100% 5% 20,642 100% 11% 5,494 100% 10% AEON Insurance 712 4% 5% 737 4% 4% 762 4% 3% 197 4% 4% ACS Servicing 1,413 8% 22% 1,604 9% 14% 834 4%

  • 48%

198 4%

  • 36%

Cambodia 319 2% 22% 352 2% 10% 504 2% 43% 188 3% 104% Myanmar 98 1% 41% 159 1% 63% 272 1% 71% 89 2% 53% Laos 40 0.2% 89% 76 0.4% 89% 102 0.5% 34% 29 0.5% 30% 587 ##### 587 ##### 3.30%

3) Accounts Receivable

(Million Baht)

Fiscal Year

Amount

%

y-y* Amount

%

y-y* Amount

%

y-y* Amount

%

y-y*

  • 1. Credit Card

28,711 43% 13% 34,588 46% 20% 36,623 44% 6% 37,067 43% 1%

  • 2. Hire Purchase

1,444 2%

  • 12%

1,267 2%

  • 12%

2,118 3% 67% 2,611 3% 23%

  • 3. Loan

35,827 54%

  • 1%

39,797 52% 11% 43,590 53% 10% 45,446 53% 4%

  • 4. Others

146 0.2%

  • 55%

172 0.2% 18% 180 0.2% 5% 127 0.1%

  • 29%

Total 66,128 100% 4% 75,824 100% 15% 82,512 100% 9% 85,252 100% 3% Overseas (CLM) 1,808 3% 37% 2,164 3% 20% 3,627 4% 68% 4,230 5% 17%

2018

28Feb'19

2018

31May'19

1Q

31May'19

1Q

31May'19

1Q

28Feb'19

2018

28Feb'19

2017

28Feb'18

2017

28Feb'18 28Feb'18

2016

29Feb'17

2017

Note: *Compared with the the end of previous fiscal year

2016

28Feb'17

2016

28Feb'17

slide-7
SLIDE 7
  • 4. Financial Highlights (Cont’d)
  • 5 -

4) Cost structure

(Million Baht) Fiscal Year Amount

% Rev

y-y Amount

% Rev

y-y Amount

% Rev

y-y Amount

% Rev

y-y Operating and admin expenses 7,509 42% 3% 8,153 44% 9% 8,702 42% 7% 2,282 42% 9% Bad debt and doubtful accounts 5,117 29% 8% 4,679 25%

  • 9%

5,285 26% 13% 1,395 25% 16% Funding cost 2,110 12%

  • 8%

2,104 11% 0% 2,175 11% 3% 544 10%

  • 1%

Other expenses 32 0%

  • 13

0% -58% 51 0% 278% 1 0%

  • 13%

Total Expenses 14,769 83% 3% 14,950 80% 1% 16,213 79% 8% 4,221 77% 10%

5) Bad Debt

(Million Baht) Fiscal Year y-y y-y y-y y-y

  • 1. Beginning Allowance
  • 1%
  • 6%

7% 19%

  • 2. Provision for Bad debt

8%

  • 9%

13% 16%

  • 3. Write-off amount

10%

  • 14%

7% 14%

  • 4. Ending Allowance
  • 6%

7% 19% 20% % of Accounts Receivable D3 up / Accounts Receivable Coverage Ratio

6) Breakdown of Borrowings (All converted into Thai Baht)

(Million Baht) Short Term Loans Baht Yen USD Lak MMK Current portion of loans&B/E Current portion of Debenture Long Term Loans Baht Yen USD Debenture (baht)- Long term Total Borrowings LTB/Total Borrowings 68% 1,151 8,254 4,106 45,027 11,395 15,766 10,292 66,528 8,541 16,112 12,958 63,658 75% 954 6,072 1Q 31May'19 1Q 31May'19 Amount 2,880 1,395 (1,213) 3,062 3.59% 2.82% 127% 7,574 31May'19 9,141 6,221

  • 1,471

298 2,981 47,505 9,893 126%

  • 1,142

4,690 28Feb'19 7,100 315 2,416 5,285 (4,820) 2,880 3.49% 2.76% 2018 28Feb'19 2018 28Feb'19 Amount 3.18% 2.35% 28Feb'18 41,034 8,491 6,964 12,671 3,952 2,820

  • 384

225 523 136% 12,662 1,685 2017 28Feb'18 2017 28Feb'18 Amount 2,260 4,679 (4,523) 2,416 2.71% 28Feb'17 Amount 2,412 5,117 (5,269) 3,502 2,580

  • 2016

28Feb'17 2016 28Feb'17 126% 2,260 3.42% 565 12,908 59,334 69% 11,250 55,648 71% 39,283 2,499 13,849 11,685 150 207 9,391 3,472