
SLIDE 1
1
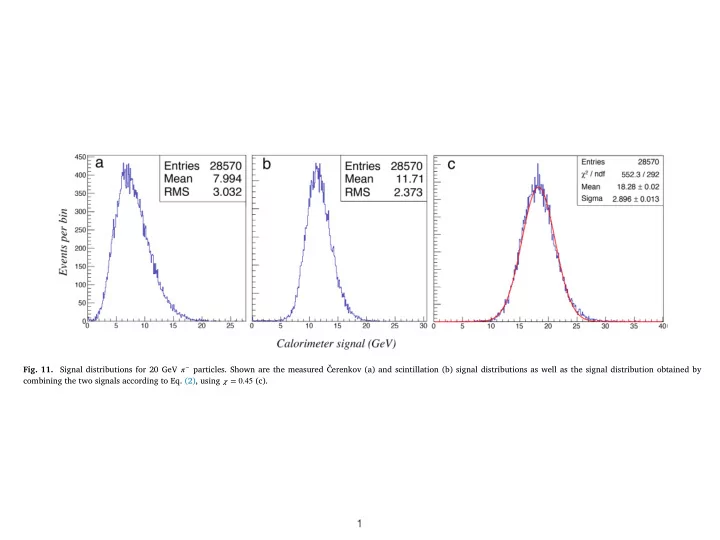
- Fig. 11. Signal distributions for 20 GeV ⇡* particles. Shown are the measured Éerenkov (a) and scintillation (b) signal distributions as well as the signal distribution obtained by
combining the two signals according to Eq. (2), using = 0.45 (c).