
SLIDE 1
Year ear-end end Repor eport 2019 2019 This presentation may - - PowerPoint PPT Presentation
Year ear-end end Repor eport 2019 2019 This presentation may contain forward-looking statements. Such statements are based on our current expectations and are subject to certain risks and uncertainties that could negatively affect our
January 22, 2020 Year-end Report 2019 2
This presentation may contain forward-looking statements. Such statements are based on our current expectations and are subject to certain risks and uncertainties that could negatively affect our
report for a better understanding of these risks and uncertainties.
2019 vs 2018
Year-end Report 2019 3 January 22, 2020
1) Net sales which excludes exchange rate effects, acquisitions and divestments 2) Excluding items affecting comparabilityAdjus Adjusted ted EBI BITA A Mar argin gin2)
2)
Net S et Sales ales Adjus Adjusted ted EBI BITA2)
2)
Organic ganic Net S et Sales ales1) x% x% Adjus Adjusted ted ROCE CE2) Adjus Adjusted ted ROE2) Oper perating ting Cas Cash h Flo low Ear arnings nings per S per Shar hare
SEK SEK 128,975m 128,975m +8.8 +8.8% +4.5% +4.5% SEK SEK 15,840m 15,840m +22% +22% 12.3% 12.3% +140bps +140bps 18.4% 18.4% 13.8% 13.8% SEK SEK 13.1 13.12 SEK SEK 15,639m 15,639m +58% +58%
▪ Strong organic net sales growth and higher adjusted EBITA margin ▪ Higher volumes, higher prices, better mix and cost savings ▪ Lower raw material costs but negative impact from stock revaluation ▪ Investments in growth increased sales and marketing costs ▪ EPS increased 17% ▪ The Board of Directors proposes an increase
▪ Successful innovations strengthening market positions and brands ▪ Price increases and improved product mix ▪ Online sales increased to approx. SEK 13bn ▪ Cost savings of approx. SEK 1.1bn ▪ Our initiative “Cure or Kill” has increased profitability in several markets ▪ Strong performance in Latin America and Asia ▪ Improved cash flow and strengthened balance sheet ▪ Continued work to contribute to a sustainable and circular society
Year-end Report 2019 January 22, 2020 4
Strong growth and higher profitability
Q4 2019 vs Q4 2018
Year-end Report 2019 5 January 22, 2020
1) Net sales which excludes exchange rate effects, acquisitions and divestments 2) Excluding items affecting comparability▪ Strong organic net sales growth and higher adjusted EBITA margin ▪ Higher volumes, higher prices, better mix and cost savings ▪ Lower raw material and energy costs but negative impact from stock revaluation ▪ Investments for growth and incentive programs increased sales and marketing costs
Adjus Adjusted ted EBI BITA A Mar argin gin2)
2)
Net S et Sales ales Adjus Adjusted ted EBI BITA2)
2)
Organic ganic Net S et Sales ales1) x% x% Adjus Adjusted ted ROCE CE2) Adjus Adjusted ted ROE2) Oper perating ting Cas Cash h Flo low Ear arnings nings per S per Shar hare
SEK SEK 33,686m 33,686m +8.3 +8.3% +3.6% +3.6% SEK SEK 4,742m 4,742m +37% +37% 14.1% 14.1% +300bps +300bps 19.9% 19.9% 16.4% 16.4% SE SEK K 3.87 3.87 SEK SEK 4,753m 4,753m +46% +46%
28,155 27,178 28,664 28,020 29,721 29,647 31,112 30,656 32,068 32,565 33,686
+1.8% +1.8% +3.4% +2.3% +1.6% +3.3% +4.3% +3.9% +5.9% +3.6%
0,00% 1,00% 2,00% 3,00% 4,00% 5,00% 6,00% 7,00%
25000 27000 29000 31000 33000 35000 37000 39000 Q2 2017 Q3 2017 Q4 2017 Q1 2018 Q2 2018 Q3 2018 Q4 2018 Q1 2019 Q2 2019 Q3 2019 Q4 2019 Net Sales, SEKm Organic Net Sales Growth, %
Year-end Report 2019 January 22, 2020 6
3,437 3,432 3,619 3,119 3,349 3,016 3,451 3,190 3,732 4,176 4,742 12.2% 12.6% 12.6% 11.1% 11.3% 10.2% 11.1% 10.4% 11.6% 12.8% 14.1%
7% 8% 9% 10% 11% 12% 13% 14% 15% 16%
2000 2500 3000 3500 4000 4500 5000 5500 6000 6500 7000 Q2 2017 Q3 2017 Q4 2017 Q1 2018 Q2 2018 Q3 2018 Q4 2018 Q1 2019 Q2 2019 Q3 2019 Q4 2019 Adjusted EBITA, SEKm Adjusted EBITA margin, %
Adjusted EBITA and EBITA margin2) Net Sales and Organic Net Sales Growth1)
1) Organic net sales which excludes exchange rate effects, acquisitions and divestments 2) Excluding items affecting comparability Year-end Report 2019 January 22, 2020 7
Q4 2019 vs Q4 2018
Net Sales Q4 2018 Volume Price/Mix Divestment Currency Net Sales Q4 2019
+2.3% +5.0% +1.3% +8.3% Organic Net Sales1) +3.6% SEK 31,112m SEK 33,686m
1) Net sales which excludes exchange rate effects, acquisitions and divestments 1)
Q4 2019 vs Q4 2018
Year-end Report 2019 January 22, 2020 8
Adjusted EBITA Q4 2018 Volume Price/Mix Raw Material Energy Cost Savings COGS Cost-savings Program Other Currency Adjusted EBITA Q4 2019
Organic Adjusted EBITA +29%2)
SEK 3,451m
+37%
SEK +215m SEK +315m SEK +1,487m SEK +119m SEK +4m SEK -1,340m SEK +289m SEK 4,742m
1) 1) 1) Excluding items affecting comparability 2) Excluding items affecting comparability and currency translation effectsSEK +202m
▪ Higher sales and marketing costs ▪ Stock revaluation ▪ Higher distribution costs
Year-end Report 2019 January 22, 2020 9
75 100 125 150
Polypropylene, EUR Propylene, EUR
75 100 125 150
Fluff NBSK EUCA
40 60 80 100 120 140
SOP US SOP EU
Source: Fastmarkets RISI, Fastmarkets FOEX, VDP, Macrobond, Epexspot, ICIS
Oil-based Raw Materials2) Market Pulp in USD, Europe Paper for Recycling1)
Index 100 = July 2017 1) Sorted Office Paper. Index in local currencies. EU refers to Germany 2) Polypropylene major feedstock of non-woven material, Propylene major feedstock of SAP material 3) Electricity Germany. Natural Gas, TTF Index60 85 110 135 160 185 210
Electricity, EUR Natural Gas, EUR
Energy Prices3)
6.5% 7.5% 8.5% 8.3% 10.2%
13.2% 14.1% 14.2% 12.3% 13.4% 10.8% 11.8% 12.3% 10.9% 12.3%
2015 2016 2017 2018 2019 Emerging Markets Mature Markets Group
Adjusted EBITA Margin1) Development
Year-end Report 2019 January 22, 2020
1) Excluding items affecting comparabilityShare of Net Sales Share of adjusted EBITA1) Emerging Markets: 36% 22% 37% 31%
10
▪ Cost savings: ─ Full year 2019: SEK 456m ─ Q4 2019: SEK 4m ▪ Productivity improvements from ─ Tissue Roadmap ─ Operational efficiency improvements ─ Material rationalization ─ Sourcing savings ▪ Lower COGS savings in Q4 2019 mainly due to ─ Incentive programs and pensions ─ Distribution costs
Year-end Report 2019 January 22, 2020 11
Closed with savings slightly above plan
Year-end Report 2019 January 22, 2020 12
▪ Achieved cost savings: ─ Full year 2019: SEK 637m ─ Q4 2019: SEK 202m ─ End of Q4 2019 annualized run-rate cost savings slightly above SEK 900m ▪ Headcount reduction of approx. 1,060 positions ▪ Main impact in SG&A costs ▪ Total restructuring costs of SEK 539m
17.4% 17.3%
SG&A as % of Sales
2018 2019
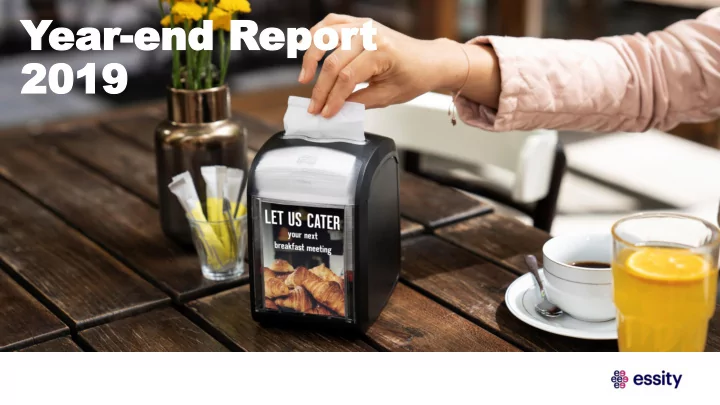
Innovations 2019
Year-end Report 2019 January 22, 2020 13
▪ Organic net sales increased 2.5% ─ Volume +1.9% and price/mix +0.6% ▪ Higher volumes, higher prices, better mix and cost savings ▪ Lower raw material costs but negative impact from stock revaluation ▪ Investments in growth and costs related to implementation of Medical Device Regulation increased sales and marketing costs ▪ Higher distribution costs
Q4 2019 vs Q4 2018
Year-end Report 2019 January 22, 2020 14
SEK 12,425m SEK 11,703m Q4 2018 Q4 2019 Q4 2018 Q4 2019 Q4 2018 Q4 2019 SEK 1,756m SEK 1,652m
Net Sales Adjusted EBITA1) Adjusted EBITA Margin1)
+6% +6% 14.1% 14.1% +2.5% Total Mature Markets Incontinence Products
By Region By Product Segment
Emerging Markets +0.1% +4.6%
+8.0% Baby Care Feminine Care % of Personal Care Net Sales: 63% 37% 45% 19% 18% 18%
+6.9% Medical Solutions
Organic Net Sales
1) Excluding items affecting comparability ▪ Organic net sales increased 4.9% ─ Volume +3.6% and price/mix +1.3% ▪ Higher volumes, better price/mix and cost savings ▪ Lower raw material and energy costs but negative impact from stock revaluation ▪ Investments in growth increased sales and marketing costs
Q4 2019 vs Q4 2018
Year-end Report 2019 January 22, 2020 15
SEK 13,269m SEK 12,094m SEK 1,767m SEK 840m
Net Sales Adjusted EBITA1) Adjusted EBITA Margin1)
+10% +640 bps 6.9% 13.3% Q4 2018 Q4 2019 Q4 2018 Q4 2019 Q4 2018 Q4 2019 +4.9% Total Mature Markets
Organic Net Sales By Region
Emerging Markets +3.6% % of Consumer Tissue Net Sales: 52% 48% +6.5% +110%
1) Excluding items affecting comparability ▪ Organic net sales increased 3.0% ─ Volume +0.7% and price/mix +2.3% ▪ Higher volumes, higher prices, better mix and cost savings ▪ Lower raw material and energy costs but negative impact from stock revaluation ▪ Investments in growth increased sales and marketing costs ▪ Positive one-off earnings impact of approx. SEK 70m from reduction of pension liabilities in the US
Q4 2019 vs Q4 2018
Year-end Report 2019 January 22, 2020 16
Q4 2018 Q4 2019
SEK 7,991m SEK 7,322m
Net Sales Adjusted EBITA1) Adjusted EBITA Margin1)
+30% +9% +280 bps 17.6% 14.8% SEK 1,085m SEK 1,408m Q4 2018 Q4 2019 +3.0% +2.3% % of Professional Hygiene Net Sales: +6.1% Total Mature Markets Emerging Markets 79% 21%
Organic Net Sales By Region
1) Excluding items affecting comparabilityQ4 2018 Q4 2019 Q4 2018 Q4 2019
▪ Continue to invest in our strong brands ▪ Price management ▪ Efficiency improvements ▪ Grow high margin categories ▪ Capitalize on growth opportunities in emerging markets ▪ Accelerate the digital transformation ▪ Continue to contribute to a sustainable and circular society
Year-end Report 2019 January 22, 2020 17